BF Eri flickering
Observations: October, November 2004
Michel Bonnardeau
Updated: 25 November 2004
Abstract
The cataclysmic dwarf nova BF Eri is observed by differential photometry. The light curves are searched for periodicities.Introduction
BF Eri is a cataclysmic dwarf nova, that is a binary star with accretion. Little seems to be known about it (actually, it is misclassified as an SR in the GCVS) (Kato (1999)). The orbital period is not known. This makes it interesting for photometric time series.
Observations
BF Eri was observed over 5 nights and 957 images were obtained for differential photometry. The time series were done the following nights: 23 October 2004 and 13 November 2004 (when the object was in a high state), then 19, 20, 21 November 2004.
The telescope is a 203 mm f/6.3 SC with a SBIG ST7E camera (KAF401E CCD) and a Clear filter. Each exposure is 1-minute duration.
The comparison star is GSC 4743-00797 with an assumed unfiltered magnitude of 12.5. There are 2 check stars:
A sample image can be seen from here.
The light curve for the 21 November 2004 is the following:
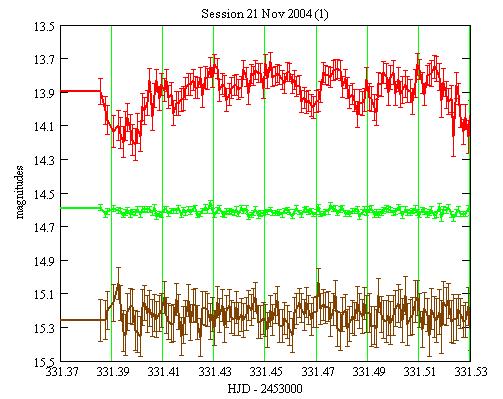

Red: the light curve for BF Eri.
Green: for the K star, shifted by +3.5 magnitudes.
Brown: for the K1 star, shifted by +1 magnitude.
The error bars are +/- the 1-sigma statistical uncertainties.
All the light curves are here.
Analysis
Cataclysmic stars may display periodic variations of their brightness due to the orbital motion. If the primary is magnetic, the spin or the synodic periodicity may show up. Quasi-periodic variations may also come from the rotating accretion disc.
The FFT spectrum of the data is:

The data are resampled into 65536 points with an interval of 0.637
minute. The average magnitude is used between the observing sessions.
Faint peaks may be seen for the following periods: 9.6 hours (2.5 days^-1), 3.4 hours (7 days^-1), 80 mn (18 days^-1) (with an harmonic), 57.6mn (25 days^-1).
The data are also analysed with the TS program developped by the AAVSO.
It uses the Date Compensated Discrete Fourier Transform algorithm and should be
better adapted than the FFT as the data are not regularly sampled. The spectrum is:

The 9.6 h and 3.4 h signals do not show up, but those at 80 mn and 57.6 mn are still there, but very faint.
Reference
T. Kato (1999) IBVS 4745.
|
|
|||
|
|||
|
|
|||
|
|
|||
|
|||