The signs for the angles are for my setup (SC telescope, ST7E camera with the connectors upwards). With another setup, they may be reversed.
The image is rotated such as the spectrum is along the large side of the CCD (the x axis).
The basic equation for the diffraction is:
where a is the incident angle, b of the diffracted light ray,
k=1 is the order,
m=100 groves/mm,
l the wavelength.
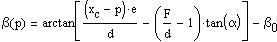
The incident angle a is given by:
where F is the focal length,
xc is the coordinate in pixels of the CCD center (xc=L/2 with L the CCD width in pixels),
x0 is the coordinate in pixels of the star on the CCD,
e is the pixel size.
To the diffraction angle b I add a constant angle b0 (another way to see it would be to consider that the order 0 is deviated by b0):
with d0 the distance between the grating and the CCD and
Let be yc the coordinate of the CCD center along the y axis and y0 the coordinate of the star. The distance d0 is actually to be replaced by d with:
with
The distance d between the grating and the CCD can be determined by observing a spectrum line of wavelength l at the coordinate p in pixels:
(1)
with
Computation of l as a function of p:
(2a)
(2b)
Example
Here is a spectrum of AE Aqr:
The large emission line at p=252.8 is the Ha 6563, the other 2 lines are believed to be the Hb 4861 at p=348.2 and the telluric O2 7609 at p=192.
Assuming b0=0, the distance grating-CCD can be computed from the Ha line and (1). The spectrum can then be calibrated in wavelengths owing to (2a) and (2b):
The Hb and O2 lines are not at the right positions. I fiddle b0 to improve their positions: