ASAS1826+12: the eclipsing Cepheid
Observed: 7, 12, 13, 14, 15, 17, 19 July, 5, 18 Aug, 5, 6, 12, 15, 19, 20 Sept, 2, 4, 13, 14, 15, 16, 18 Oct, 3, 8 Nov 2007
Michel Bonnardeau
24 Sept 2007
Revised 27 Sept 2007
Revised 30 Sept 2007 ("weighted" transformation coefficients)
Updated 5 Oct 2007 (more observations)
Revised 10 Oct 2007 (B transformed from TbTbv instead of
Tbv, I transformed from R instead of V)
Updated 11 Oct 2007 (one more observation in Rc, transformed
from Ic)
Updated 18, 20 Oct, 25 Nov 2007 (more observations)
Abstract
Multicolor photometric measurements of this Cepheid in an eclipsing binary system (the only known one in our galaxy) are presented.
Introduction
ASAS1826+12 (actually ASAS182611+1212.6 or ASAS182612 or TYC 1031 01262 1) is the first known Cepheid in an eclipsing binary system in our galaxy (Antipin et al (2007)). The pulsational period is 4.2 days and the orbital period is 51.4 days. Both the primary and secondary eclipses are visible and there is an orbital modulation between them.
The ephemerides are (Antipin et al (2007)):
Pulsation maximum = 2,453,196.529 + 4.1523*E
Primary eclipse minimum = 2,453,571.36 + 51.38*E
The AAVSO issued the Alert Notice 351 (June 8, 2007) to start a campaign of observations of this system (and of KU Her in the same field).
Observations
The observations were carried out with a 203mm f/6.3 SC telescope, BVRcIc Johnson-Cousins filters (from Schuler) in a filter wheel and a SBIG ST7E camera (KAF401E CCD). Each exposure is 200s long with one exposure/measurement (no stack).
For the photometry, the comparison star and the check star recommended
by the AAVSO are used. They are:
| ID | RA(J2000) | DEC | V | B-V | V-Rc | Rc-Ic | V-Ic |
| comp | 18:26:09.44 | +12:17:37.2 | 11.914 | 0.748 | 0.444 | 0.432 | 0.876 |
| check | 18:26:23.68 | +12:15:47.2 | 10.892 | 0.665 | 0.383 | 0.358 | 0.738 |
The phase coverage of the observations:
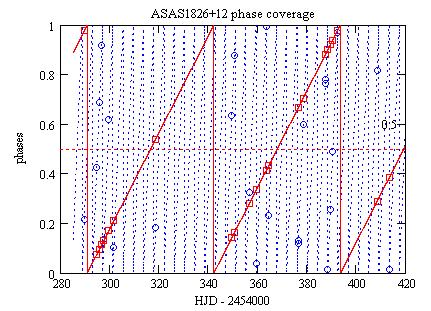
Red solid line: the orbital phase;
Blue dot line: the pulsational phase;
Red squares: the orbital phases of the V measurements;
Blue circles: the pulsational phases of the V measurements.
Transformations
The measured b,v magnitudes may be transformed
for the instrument response. The transformed B,V magnitudes are then:
V = v + TvTbv*[(b-v)-(Bc-Vc)]
B = b + TbTbv*[(b-v)-(Bc-Vc)]
Bc,Vc are the magnitudes of the comparison star. The transformation coefficients
were measured HERE; they are:
TbTbv = 0.002 +/- 0.027
TvTbv = -0.025 +/- 0.015
The transformed R magnitudes (Rc filter) are computed from the observed
r magnitudes the same way:
R = r + TrTvr*[(v-r)-(Vc-Rc)]
with the transformation coefficient:
TrTvr = -0.134 +/- 0.017
(one Rc measurement without a match in V in transformed
using a Ic measurement).
And the transformed I magnitudes (Ic filter) from the observed i magnitudes:
I = i + TiTri*[(r-i)-(Rc-Ic)]
with the transformation coefficient:
TiTri =0.022 +/- 0.011
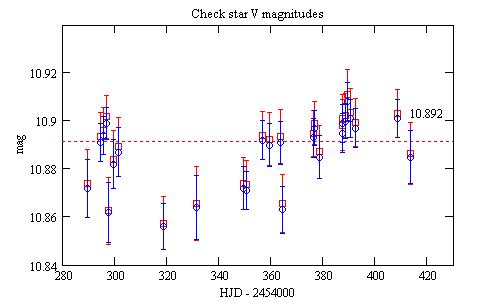
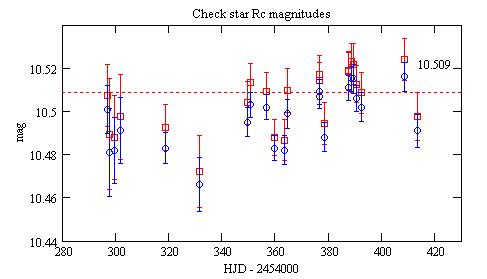
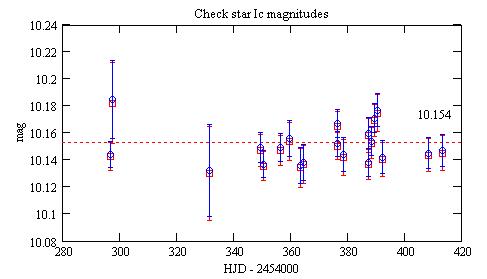
Check star
The raw magnitudes and the transformed magnitudes of the check star
are:
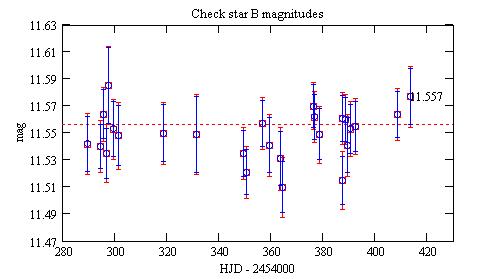
Blue circles: the raw magnitudes, the error bars are +/- the 1 sigma
statistical uncertainties;
Red squares: the transformed magnitudes, the errors bars are computed
from the +/- 1 sigma statistical uncertainties on the raw magnitudes and
the standard deviations on the transformation coefficients;
11.557 is the magnitude according to the AAVSO.
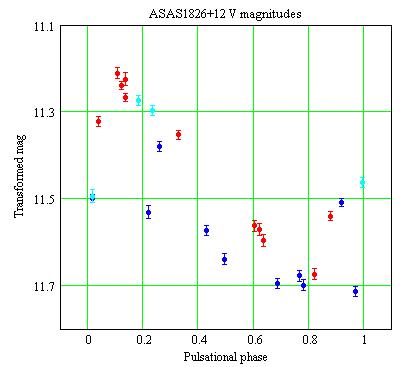
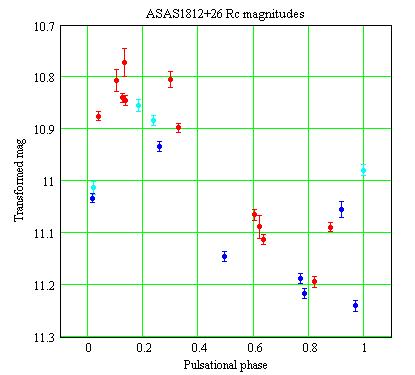
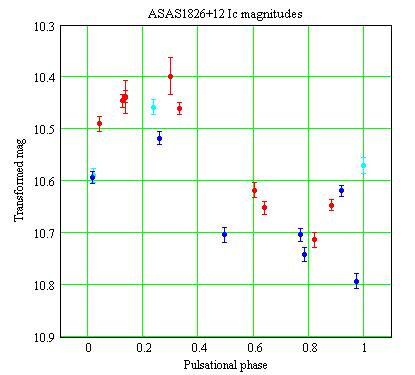
Pulsational phase analysis
Assuming that the eclipses have a width of 0.25 phase, the transformed
magnitudes as a function of the pulsational phases are:
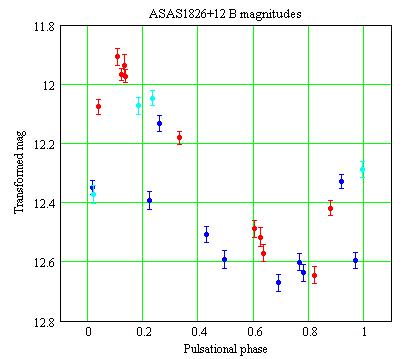
Blue: for the orbital phases around the primary eclipse;
Cyan: for the orbital phases around the secondary eclipse;
Red: all the other (they are still modulated by the orbital movement according
to Antipin et al (2007)).
The error bars are computed from the 1 sigma statistical uncertainties
on the raw magnitudes and the standard deviations on the transformation
coefficients.
Another pulsational phase plot:
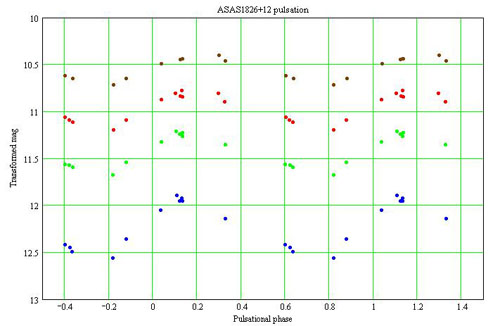
The magnitudes are for the orbital phases outside
the eclipses:
Blue: B magnitudes;
Green: V magnitudes;
Red: Rc magnitudes;
Brown: Ic magnitudes.
Late by 0.12 pulsational period?
Orbital phase analysis
The diameter of a cepheid is at its maximum when the brightness is diminishing (around phase 0.25) and it is at its minimium when the brightness is on its rise (~0.75); see for example TX Mon.
When the cepheid of this binary system is eclipsed, the eclipse width should then be larger when the diameter is at its maximum.
Reference
Antipin S.V., Sokolovsky K.V., Ignatieva T.I. (2007) MNRAS arXiv/astro-ph:0705.0605.
Technical notes
Telescope and camera configuration.
Computer and software configuration.
Transformations for differential photometry.
Transformation coefficients: B, V measurements.
Transformation coefficients: V, Rc measurements.
Transformation coefficients: Rc, Ic measurements.
Astronomical notes
Pulsating stars and its links.
KU Her, a slow irregular variable in the field of view of ASAS1826+12.
|
|
|||
|
|||
|
|
|||
|
|
|||
|
|||