FO Aqr: 2017 season and a new fading
Observed: 7 June, 28 July, 21, 22 Aug, 12, 14, 24 Sep, 5, 14, 26 Oct 2017
Michel Bonnardeau
8 Sept 2017
Updated 13, 14, 15, 25 Sep, 6, 16, 28 Oct 2017, 3 Apr 2019 (O-C)
Abstract
Observations of the intermediate polar FO Aqr are presented for 2017. They show that the object is fading.
Introduction
FO Aqr is a cataclysmic system and an intermediate polar. These observations are a follow-up of my 2004-15 observations and of my 2015-16 observations.
Observations
The observations in the 2017 season are carried out with the same setup and the same comparison star as with the previous seasons.
For the differential photometry, the comparison star is GSC 5803-398 (UCAC4 409-138153 with V=10.921 mag). The check star is UCAC4 409-138161.
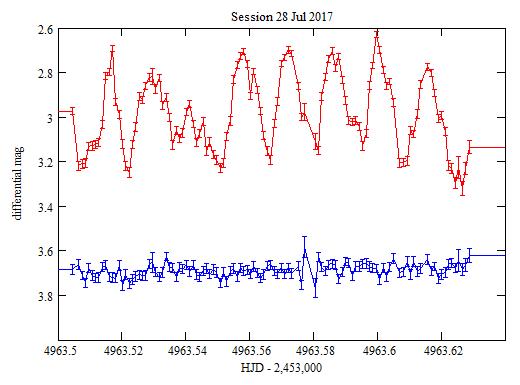
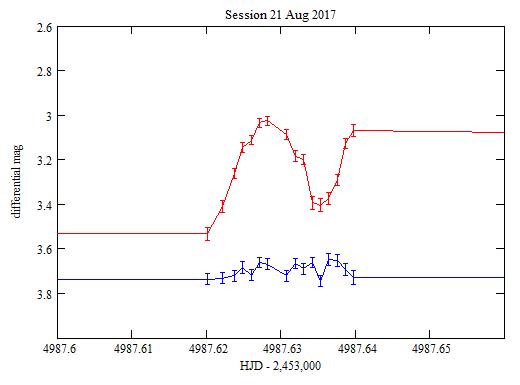
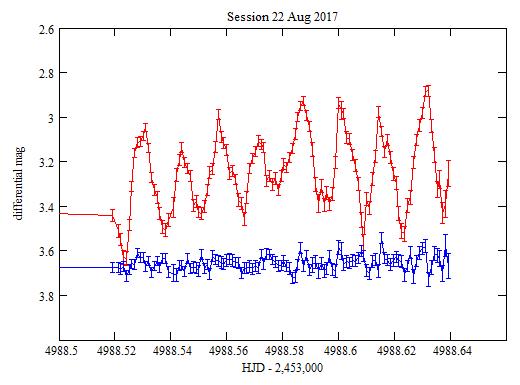
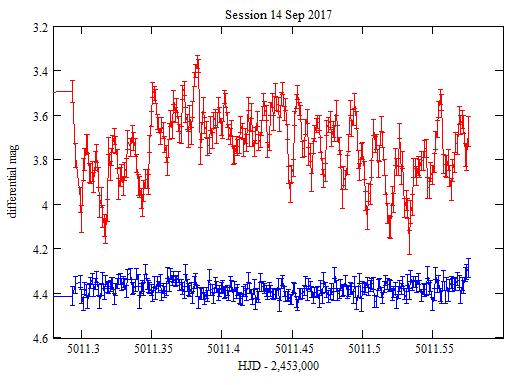
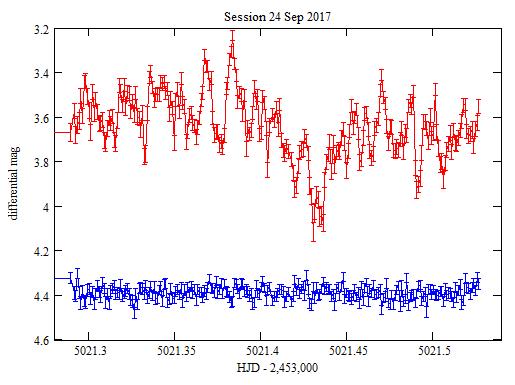
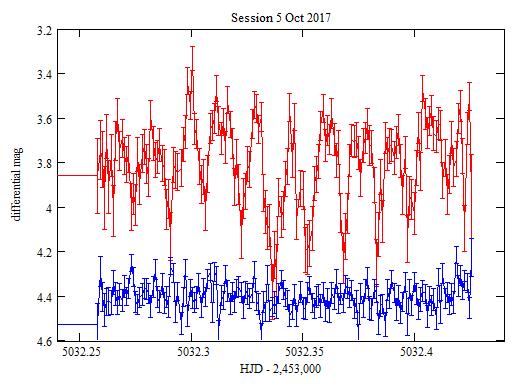
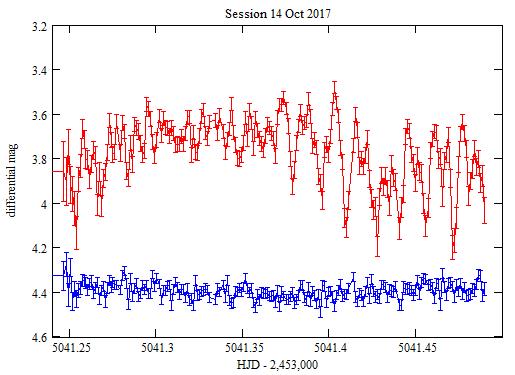
1643 usuful images in 10 sessions are obtained. The light curves:
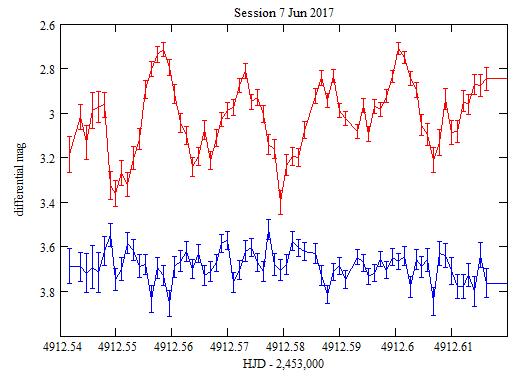
The magnitudes are the differences with the comparison star. Red: FO Aqr, Blue:
the check star shifted by +0.3 mag. The error bars are the
quadratic sum of the 1-sigma statistical uncertainties on the variable and of the comparison star.

The check star magnitudes are shifted by +1.0 mag.
During Full Moon.

Averages
With the magnitudes averaged over each night:
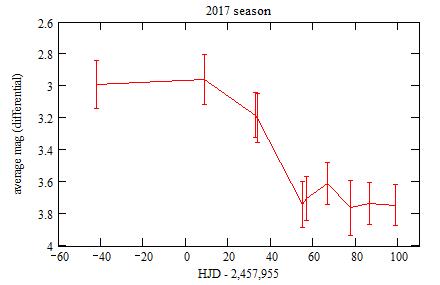
The bars are +/- the standard deviations over each night.
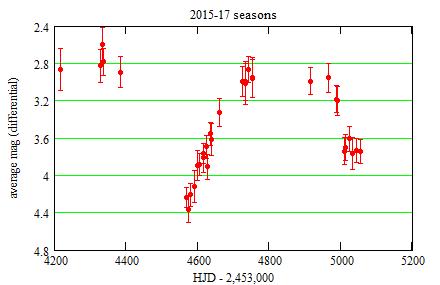
The object is fading. This was reported by Littlefield et al (2017).
Fourier spectra
Fourier spectra obtained with the PERIOD04 software program (Lenz & Breger (2005)):
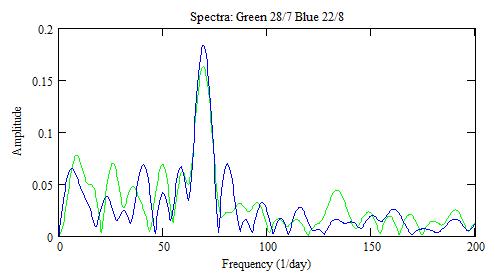
The main signal (at 69) is due to the spin of the white dwarf.
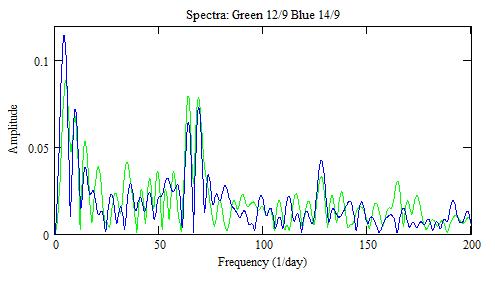
The following signals may be identified: 69 spin, 64 spin-orbit with
an harmonic at 128, 5 the beat between the previous ones with several
harmonics. See also Littlefield
et al (2017).
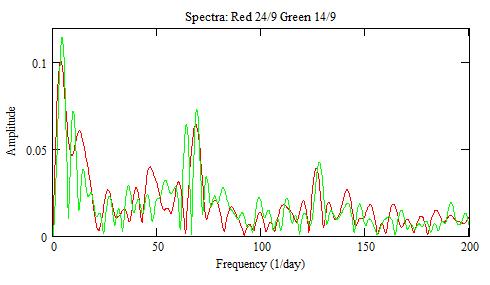
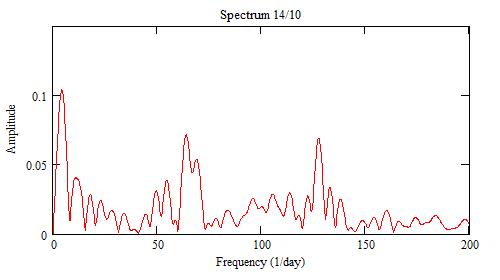
The 4 highest peaks are, in increasing frequencies: orbit, spin-orbit, spin, 2(spin-orbit).
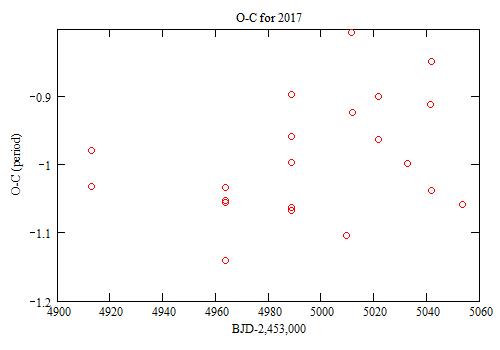
O-C analysis
I proceed the same way as I did for the
2015-16 analysis: I select a number of indivual pulses, strong and
well defined, and I compute the O-C from my 2004-15 ephemeris (unstead
of filling the light curves with an analytical function). I identify 21
such pulses. The resulting O-C diagram is:
I compute then
the average O-C for the season. The resulting
O-C diagram, along with the measurements of the previous seasons, is:
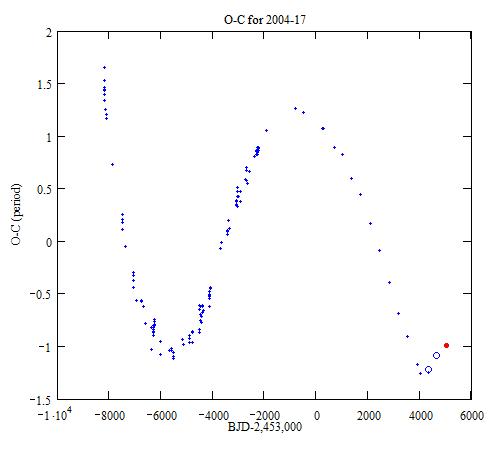
Blue dots: from Bonnardeau (2016), blue circles:
2015 and 2016 observations,
red dot: 2017 observations.
References
Bonnardeau M. (2016) IBVS 6181.
Lenz P. and Breger M. (2005) Comm. Asteroseismology 146 53
Littlefield C. et al (2017) ATEL #10703
Technical notes
Telescope and camera configuration.
Computer and software configuration.
|
|
|||
|
|||
|
|
|||
|
|
|||
|
|||