Feige 7: a rotating white dwarf
Observed: 16 Oct, 18 Nov, 13, 14, 15, 22, 23, 24, 25 Dec 2006
Michel Bonnardeau
7 Aug 2007
Abstract
A phase plot for this magnetic, rotating (period 2.2h), lone white dwarf is presented.
Introduction
Feige 7 (or BV Cet) is a lone white dwarf with a strong off axis magnetic field; see Achilleos et al (1992) for a review of its properties.
Observations
The observations were carried out with a 203mm SC telescope, a Clear filter and a SBIG ST7E camera (KAF401E CCD). Each exposure is 200s long.
For the differential photometry, the comparison star is GSC 5269-02054 with an assumed unfiltered magnitude of 13.0, and the check star is GSC 5269-01416. 536 measurements were obtained. The measured average magnitude for the check star is 14.161 with the standard deviation 0.0193.
An example of a light curve:
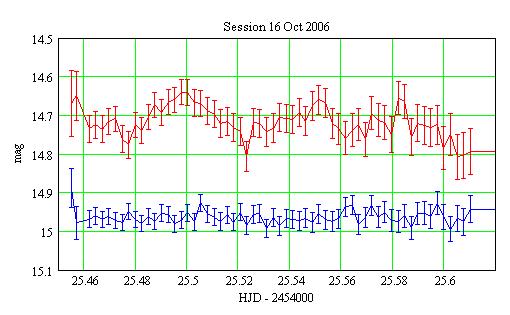
Red: Feige 7, Blue: the check star shifted by +0.8 mag. The error
bars are +/- the 1-sigma statistical uncertainties.
Filtering out the observations
The measurements were filtered out to reject low quality data using procedures from Gary (2007) (chapter 13):
Rejection for high "extra losses"
The magnitude V of the variable star is computed from the magnitude C
of the comparison star from:
V-C = -2.5*log(IV/IC)
where IV and IC
are the intensities (number of ADU from the CCD) of the variable and of the comparison respectively.
The quantity:
ZP = 2.5*log(IC) + C
is the "zero point" of the photometry.
For each session, the zero points of the photometry are plotted against
the air mass. The plot show a linear decrease of ZP with the air mass and "extra losses".
An example of such a plot:
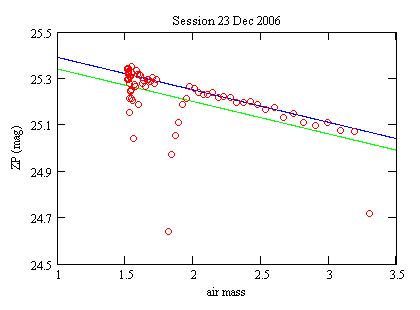
Red circles: the measurements;
Blue line: the trend ZP(air mass). The measurements below this line
are "extra losses";
Green line: the images with the "extra losses" below this line are rejected.
The images with "extra losses" greater than 0.05 mag are rejected.
After rejection for high "extra losses", there are 407 images left. The standard deviation of the check star is then 0.0176 mag.
Outlier rejection
After folding the data with the rotation period (see below), the differences
between each measurement of the variable and its 4 nearest neighbors are
computed. The images where this difference is greater than a threshold
are rejected.
The average difference is Da=0.033 mag with the standard deviation Ds=0.017.
With a threshold of Da+2*Ds, there are 386 images left. The standard deviation
for the check star is unchanged.
Phase plot
The rotation period is 131.606mn, with a
"positive going zero crossing of circular polarization"
at 2,442,749.9916 (Liebert et al (1977)). Folding the data
with this period and phasing gives the phase plot:
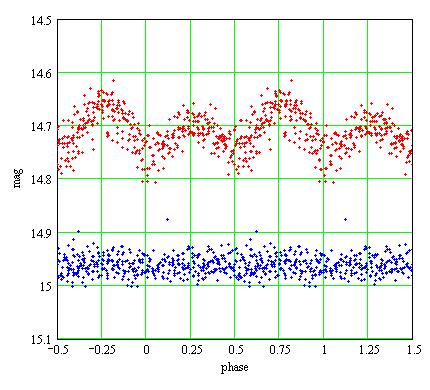
Red: Feige 7; Blue: the check star, shifted by +0.8 mag.
References
Achilleos N., Wickramasinghe D.T., Liebert J., Saffer R.A., Grauer A.D. (1992) ApJ 396 273.
Gary B. (2007) Exoplanet observing for amateurs Reductionist Publications.
(May be downloaded from
http://brucegary.net/book_EOA/x.htm.)
Liebert J., Angel J.R.P., Stockman H.S. (1977) ApJ 214 457.
Technical notes
Telescope and camera configuration.
Computer and software configuration.
The plot of the ZP versus the airmass is straightforward with
the AstroMB software package as both these quantities are computed and recorded.
|
|
|||
|
|||
|
|
|||
|
|
|||
|
|||