M11: open cluster distance measurement
Observed: 23 June 2006
M. Bonnardeau
18 Sept 2006
Abstract
The M11 open cluster (Wild Duck cluster, NGC6705) is observed through B and V filters. An HR diagram is constructed. It is compared with an absolute HR diagram made from Hipparcos data which measured the parallaxes of nearby stars. The distance to M11 is then derived. The interstellar extinction is taken into account using the Henden's sequence for M11 (U data).
Observations
I observed M11 with a 203mm f/6.3 SC telescope, a SBIG ST7E camera (KAF401E CCD) and Johnson B and V filters. There is one 200s exposure through each filter. The images are HERE.
The images are analyzed with the AstroMB software program that detects
the stars and measures their intensities by fitting each of them with
a PSF (a Gaussian). The star magnitudes are computed by comparing them
with the Tycho catalog (the VT and BT
magnitudes of the Tycho catalog are converted into the Johnson V and B
magnitudes using Mamajek et al (2002)).
For the V filter image, 866 stars are detected with S/N>=5, 41 Tycho stars
are used as comparison stars with an average dispersion around the Pogson's
law of 0.26 mag (0.79 max).
For the B filter image, 324 stars are detected, 40 Tycho comparison stars
are used, with an average dispersion of 0.20 mag (0.56 max).
The stars detected with the V and B filters are matched with a dedicated
software program (UT_M11.exe). 280 stars are detected on both the V and
B images within 7 arcminutes from the cluster center. An Hertzsprung-Russell
diagram (V versus the color B-V) can be construsted:
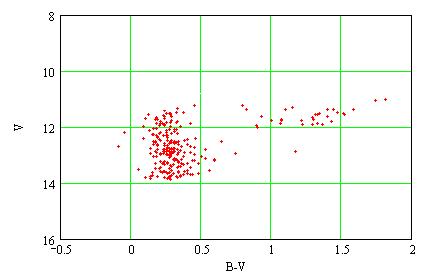
The average magnitudes are <V>=12.52 and <B-V>=0.39.
Absolute HR diagram
An absolute Hertzsprung-Russell diagram is built from the data of the
Hipparcos satellite (ESA (1997)). This satellite accuratly measured the
parallaxes of nearby stars (then the distances) along with their magnitudes.
118218 stars were observed. I use only the stars with a precision on their
parallax measurements better than 20%, ie 49239 stars. The resulting HR
diagram for absolute V magnitudes (magnitudes for the stars at 10 pc)
versus B-V colors is:
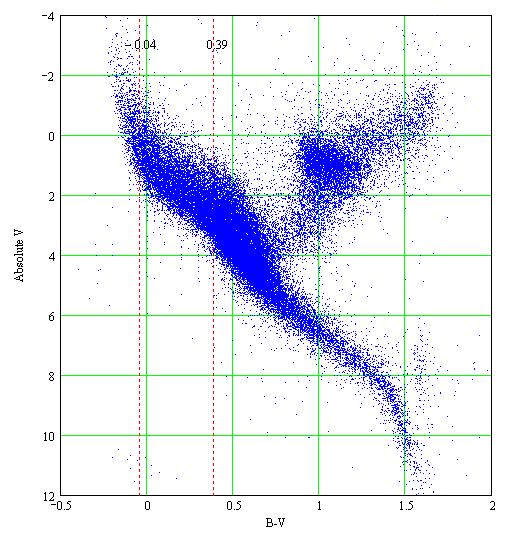
The mark at 0.39 is my measure of <B-V>. The mark at -0.04 is
<B-V> corrected for the interstellar extinction (see below).
First estimation of the distance
My measure of <B-V> matches the absolute magnitude MV=2.64
on the Hipparcos HR diagram. The distance is then:
d = 10^(<V> - MV + 5)/5 = 1.0 kpc.
However, with a distance this large, the interstellar extinction should be taken into account:
Interstellar extinction
The interstellar extinction is caracterized by the R parameter defined
as:
R = AV/E(B-V)
with AV the dimming in V, and E(B-V) the reddening
(in magnitudes). For the Milky Way
R=3.1.
The color-color diagrams, U-B versus B-V, of star clusters show a minimum at B-V=0.17 and a maximum at B-V=0.47 (Mermilliod (1981)).
Then the interstellar extinction of M11 may be taken into account the following way:
I was not able to observe M11 with a U filter. I use then the Henden's
sequence for M11. In this sequence of 2069 stars, 1160 are measured in
U, B, V. The resulting color-color diagram shows a minimum around B-V=0.6
and a maximum around B-V=0.9:
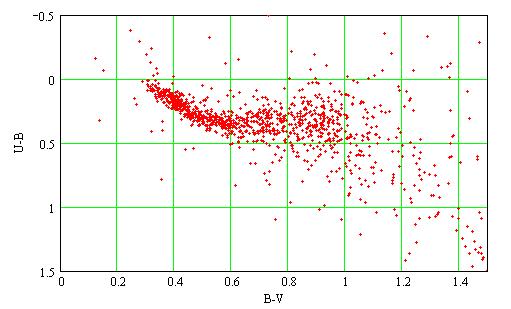
Then: E(B-V) = 0.6-0.17 = 0.43
AV = R*E(B-V) = 3.1*0.43 = 1.33
The average magnitudes that I measured become with these corrections:
<V> = 12.52-1.33 = 11.19
<B-V> = 0.39-0.43 = -0.04
On the Hipparcos HR diagram (which has no extinction because
it is derived from nearby stars) this value of <B-V> corresponds
to MV=0.36 and the distance is:
d = 10^(<V>-MV+5)/5 = 1.5 kpc
Discussion
After correction for the interstellar extinction, M11 appears as being quite blue (which implies it is very young). This part of the Hipparcos HR diagram is rather steep and the incertainty in B-V (from my measurement and from the color-color diagram minimum) translates into a large one in V.
From the Henden's sequence, that goes to fainter magnitudes than my observations,
the following HR diagram is derived:
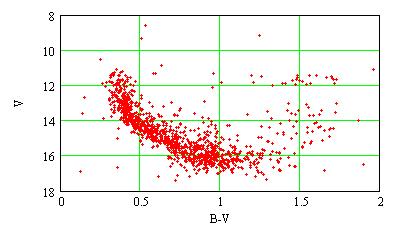
with <B-V>=0.76 and <V>=14.68. This corresponds to MV=4.75
on the Hipparcos HR diagram, then to the distance d=1.0kpc.
With the interstellar extinction, one has <B-V>=0.76-0.43=0.33 and
<V>=14.68-1.33=15. Then MV=2.31 and d=1.6kpc.
This kind of distance measurement was already done at professionnal observatories, of course. For example Sung et al (1999) used a theoretical model for stellar evolution (instead of an absolute HR diagram) to derive a distance of 2.0+/-0.1 kpc and an age of 250 Myr.
Acknowledgement
The use of Henden's sequence for M11, available from ftp://ftp.aavso.org/public/calib/, is acknowledged.
References
ESA (1997) The Hipparcos and Tycho catalogues SP-1200.
Mamajek E., Meyer M., Liebert J. (2002) AJ 124 1670M (appendix C).
Mermilliod J.C. (1981) A&A 97 235.
Sung H., Bessell M.S., Lee H., Kang Y.H., Lee S. (1999) MNRAS 310 982.
Technical notes
Telescope and camera configuration.
Computer and software configuration.
|
|
|||
|
|||
|
|
|||
|
|
|||
|
|||