140 Siwa: light/rotation curves
Observed: Oct 2005-Feb 2006
Michel Bonnardeau
16 Dec 2005
Revised: 17 Dec 2005
Updated and revised 2 Apr 2009
with more data and a new analysis.
Abstract
Time-series are obtained for this asteroid. A period of rotation is searched using a Monte Carlo algorithm.
Introduction
Minor planet 140 Siwa orbits the Sun in 4.5 yr:
Siwa orbit according to the
JPL.
Its absolute magnitude is H=8.34 mag, which suggests a diameter of
about 110 km.
It is spining with a synodic period of P=18.495 h (Le Bras et al (2001)).
However this does not seem to be well determined, as other observers have
found different values.
Observations
The observations were carried out with a 203mm f/6.3 SC telescope, a Clear filter and a SBIG ST7E camera (KAF401E CCD). Each exposure is 1mn long.
Aperture photometry is performed for each image. The comparison stars differ for each session, as the asteroid is moving. The magnitude variations of Siwa are faint (maximum of about 0.1 mag). The choice of a Clear filter is then rather unfortunate (a red or BB filter would have improved the S/N). To get the most of the photometry, a stringent extra-losses software filter (Gary (2007)) is applied for each session, with a threshold of 0.1 mag. When a few images of a time-serie are below the threshold, they are discarded. When there are many of them below the threshold the whole time-serie is discarded.
An example of a light curve:
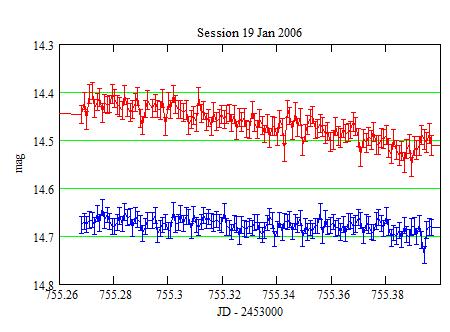
Red: Siwa, Blue: the check star. The error bars are +/- the 1-sigma
statistical uncertainties.
and of the corresponding extra losses filter:
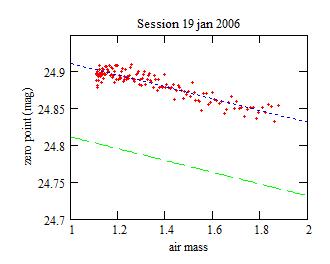
The points are expected to be along the blue line. The filter is the
green line: the images that give zero points below it are discarded.
A résumé of the 9 usable sessions:
| Session | Nb. obs | COMP star | Check star | ||
| ID | Average 1-sigma | SD | |||
| 10 Oct 2005 | 167 | Ensemble photometry (6 COMP) | UCAC2-34-394-008 = GSC-630-00771 | 0.028 | 0.033 |
| 20 Nov 2005 | 133 | UCAC2-33-686-602 = GSC-34-00610 | UCAC2-33-686-618 = GSC-35-01006 | 0.005 | 0.008 |
| 23 Dec 2005 | 52 | UCAC2-33-863-903 = GSC-34-00823 | UCAC2-33-863-894 = GSC-34-00762 | 0.007 | 0.012 |
| 19 Jan 2006 | 138 | GSC-623-00208 | UCAC2-34-768-974 = GSC-623-00395 | 0.017 | 0.018 |
| 22 Jan 2006 | 75 | UCAC2-34-769-081 = GSC-633-00962 | UCAC2-34-769-073 = GSC-623-00287 | 0.011 | 0.010 |
| 25 Jan 2006 | 152 | UCAC2-34-954-388 = GSC-623-00962 | UCAC2-34-954-376 = GSC-623-01295 | 0.033 | 0.035 |
| 31 Jan 2006 | 143 | UCAC2-35-140-616 = GSC-630-00189 | UCAC2-35-140-622 = GSC-630-00024 | 0.012 | 0.013 |
| 1 Feb 2006 | 148 | UCAC2-35-140-661 = GSC-630-00066 | GSC-630-00085 | 0.023 | 0.028 |
| 10 Feb 2006 | 119 | UCAC2-35-509-740 = GSC-634-01182 | UCAC2-35-509-738 = GSC-634-01215 | 0.022 | 0.023 |
The following sessions where discarded because of the extra losses filter:
23 Oct 2005
1 Nov 2005
24 Dec 2005
15 Jan 2006
20 Jan 2006
2 Feb 2006.
Futhermore, the session of 24 Jan 2006 was also discarded as the asteroid was moving across a crowded field.
Period search
The magnitude measurements are searched for a periodicity, which would be due to the asteroid spin.
For the first 2 sessions (10 Oct, 20 Nov 2005) the aspect of Siwa as seen from Earth and lighted by the Sun changes substantially. So these two sessions are not used in the period search. For the remaining 7 sessions, Earth is moving away from the asteroid which is seen with almost always the same aspect; see HERE diagrams of the Sun-Siwa-Earth geometry. The time of each measurement is corrected for the light time travel.
The variations of Siwa are faint but quite slow. The photometry measurements may then be grouped 4 by 4 to improve the S/N. This gives 208 measurements for the 7 sessions used in the period search.
To search for a periodicity I use a Monte Carlo algorithm the following
way:
| X | X | X |
|
|
||
|
|
||
| X |
|
|
| X |
|
|
| X |
|
|
| X | X |
|
| X | X |
|
| X | X |
|
|
|
||
The above algorithm is re-run a 100 times. This does not lead to a unique
period solution however, but rather to a spectrum strongly peaked around
19.6 hours:

The average value of the period from the 45 values in the strong peak
is:
P = 19.7266 h +/- 18 s (the uncertainty is the standard deviation)
and the magnitude shitfs are:
19 Jan 2006 +0.020+/-0.006
22 Jan 2006 -0.104+/-0.008
25 Jan 2006 -0.027+/-0.006
31 Jan 2006 -0.118+/-0.007
01 Feb 2006 -0.002+/-0.006
10 Feb 2006 -0.020+/-0.006
The resulting phase plot:
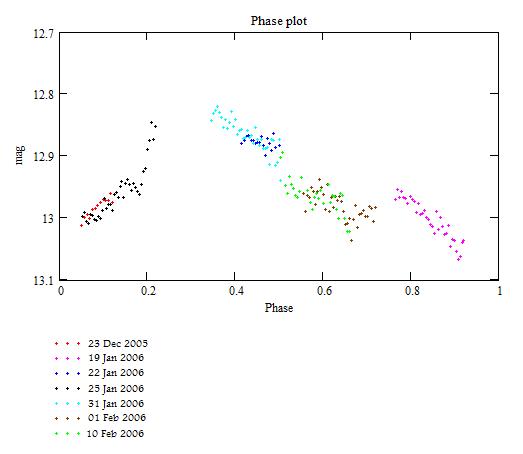
Discussion

Keeping in mind that the geometrical aspect was different of the sets used to derive the period, they may be considered as in agreement.
References
Gary B. (2007) Exoplanet observing for amateurs Reductionist Publications. (May be downloaded from http://brucegary.net/book_EOA/x.htm).
Le Bras A. et al (2001) A&A 379 660.
Astronomical note
A similar period search for asteroid 329 Svea.
Technical notes
Telescope and camera configuration.
Computer and software configuration.
|
|
|||
|
|||
|
|
|||
|
|
|||
|
|||