V1412 Aql: a simulation
Michel Bonnardeau
First version 24 Aug 2009
Updated 2 Sep 2009 (more observations)
Updated and corrected 3 Sep 2009 (more observations; uncertainties on
the ToM of the 2 eclipses taken into account at the suggestion of Wolfgang
Renz; correction of the number of solutions)
Updated 5 Sep 2009 (more observations; simulation with the period down to 1 d;
inclination)
Corrected 10 Sep 2009 (uncertainties
on the ToM of the 2 eclipses)
Updated 15 Sep 2009 (more observations)
Updated 20 Sep 2009 (more observations, slightly different ranges for
the simulation)
Abstract
A Monte Carlo simulation which may be useful to search for eclipses is proposed.
Introduction
The white dwarf G24-9 (or V1412 Aql) was observed to be unexpectedly faint on 2 occasions, in 1985 and 1988. This is interpreted as eclipses due to a dark, substellar companion (Zuckerman & Becklin (1988)).
This white dwarf has a V magnitude of 15.77 and an absolute one of Mv=13.73
(Greenstein (1984)); it is then at a distance of 25.6 pc.
From its color B-V=0.33 and Reed (1998), the white dwarf effective temperature
may be estimated as T=7248°K (neglecting the interstellar extinction
for this close object).
From Stefan's law (assuming black bodies), the white dwarf radius may
be estimated as:

with Mvo=4.83 the Sun absolute V magnitude, Ro=700,000km the Sun radius,
To=5780°K the Sun effective temperature, and BC(T) the bolometric correction
given by Reed (1998):
R= 7098 km.
Feb 2009, the AAVSO lauched a campaign to observe this object so as to detect its eclipses (AAVSO Special Notice #148).
I propose here a Monte Carlo simulation which may be useful to speed up the discovery of eclipses.
Observations
The 2 observed eclipses are:
19851007.11 (Landolt (1985)), heliocentric correction 180.56s, t85=2,446,345.612
HJD. The uncertainty is taken as et85=0.005 HJD;
19880715.3 (Carilli & Conner (1988)), heliocentric correction 441.74s,
t88=2,447,357.805 HJD. The uncertainty is taken as et88=0.05 HJD.
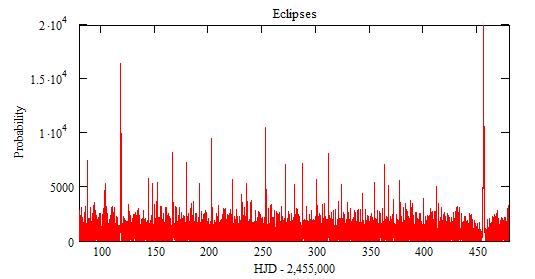
The AAVSO has 902 negative (i.e. no eclipse) observations on 15 Sep 2009.
Arne Henden obtained 14 time-series showing no eclipses, from 30 Oct to
8 Dec 2008, total duration 34.1 h. And also 7 short time-series, in 2002
and 2008, total duration 2.6h.
Robert Fridrich obtained a time-series on 1 sep 2009, duration 0.3 h.
Christian Knigge also obtained 329 negative measurements in 2009.
Simulation
The orbital period is P=(t88-t85)/n=(1012.193 days)/n where n is an
integer (assuming it is constant, i.e. no mass transfer, no third body).
G29-4 is a white dwarf, so it has a small size (about that of Earth),
then the eclipse duration tau is given mostly by the diameter D of the
occulting body:

with M the mass of the system, G the gravitational constant (taking for
the inclination i=90° and for the eccentricity e=0).
The computer simulation is a Monte Carlo one where a large number of random sets of n, M, D are used to derived ephemeris. The ephemeris that are retained are those that give the 2 observed eclipses and that do not give eclipses for the negative observations.
The algorithm works the following way:
The spectra
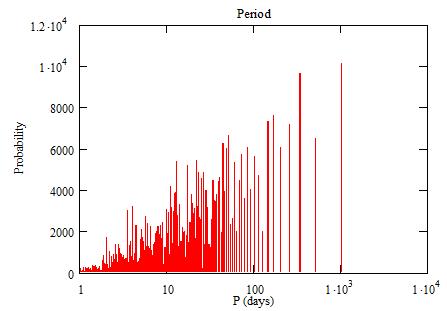
of n, M and D solutions are:

The "probability" is actually the number of acceptable solutions from
the simulation.

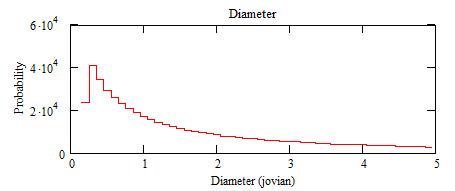
The probability for the eclipse duration:

and the period:
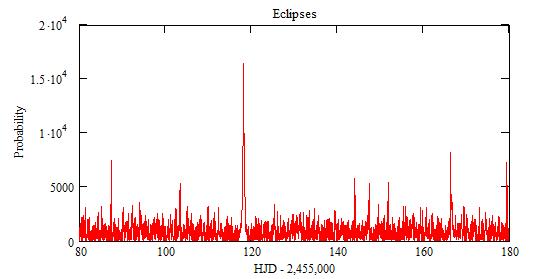
The probability for future eclipses may be computed:
However, the uncertainties et85 and et88 introduce an uncertainty on their
timing of (where t is the current time):
dt = et85+(et85+et88)*(t-t85)/(t88-t85)
dt = 0.48 day
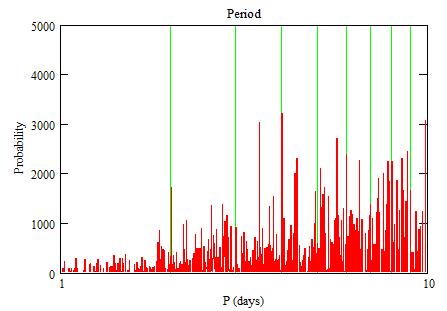
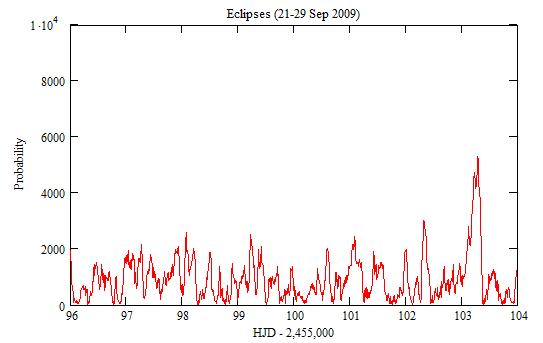
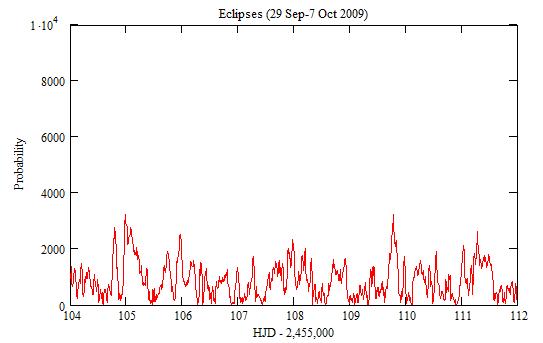
Close-up:

The small peaks correspond to n between 10 and 30. There is an uncertainty
of dt=0.48 on their position (see an illustration below for 7-15 Oct 2009).
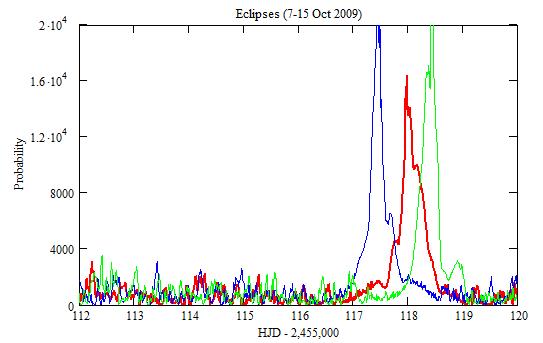
Thick red line: the probability with P0=(t88-t85)/n;
blue line: P0=(t88+et88-t85+et85);
green line: P0=(t88-et88-t85-et85).
The large peak around 118 (12 Oct 2009) +/-dt=0.48 comes from values
of n that are multiple of 3.
The red peak is smaller than the other two because of time-series around
peaks from the "red" prediction.
Other (than n=3) large periods:
n=1 and n=2: 455 THJD (15 Sep 2010)
n=4: 202 THJD (5 Jan 2010)
n=5: 253 THJD (25 Feb 2010)
n=7: 166 THJD (30 Nov 2009)
n=13: 143 THJD (8 Nov 2009)
Discussion
The minimum inclination of the orbit (so as to have an eclipse) may be estimated as:
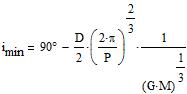
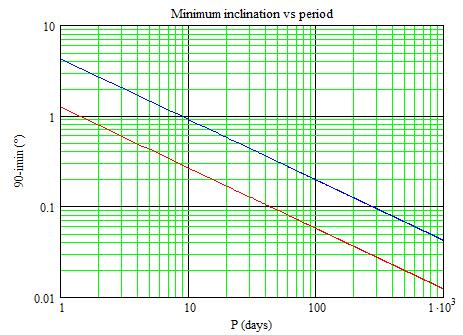
Red line: for D=1 and M=1.5; Blue line: for D=3 and M=1.
Long periods require an inclination of almost exactly 90° which would
be a somewhat improbable coincidence.
References
Carilli C., Conner S. (1988) IAU Circ. 4648.
Greenstein J.L. (1984) ApJ 276 602.
Landolt A.U. (1985) IAU Circ. 4125.
Reed B.C. (1998) J. of the Royal Astronomical Society of Canada 92 36.
Zuckerman B., Becklin E. (1988) IAU Circ. 4652.
|
|
|||
|
|||
|
|
|||
|
|
|||
|
|||