VX Hya (2008) free fall?
Observed: 7-13 Feb 2008
Michel Bonnardeau
20 Feb 2008
Updated 2, 21 March 2008, 13 Feb 2009 (slope of B-V vs V)
Abstract
Time-series for this pulsating star with multiple oscillations are obtained. They are compared with the ephemeris of Fitch (1966): they are too early by 3.7 hours. This is a strong change from previous, recent observations.
Introduction
VX Hydrae is a pulsating star probably of the delta Scuti type, with multiple periodicities. I already observed it in 2005 and in 2006 and found it late by 1.4-1.2 hour when compared with the 1954 ephemeris. Here are new observations:
Observations
The observations were carried out with a setup similar to the one used in 2005 and 2006:
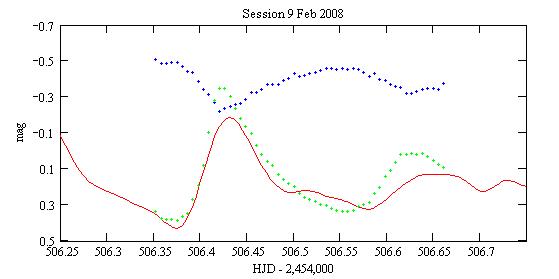
An example of a light curve:
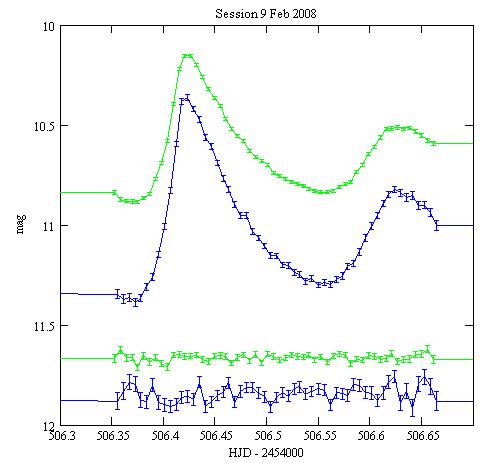
Green: with the V filter, Blue: with the B filter. The upper curves
are VX Hya, the bottom curves are the check star shifted of -1.2mag in
V, -1.6 in B. The error bars are +/- the 1-sigma statistical uncertainties.
All the light curves are HERE.
Comparison with the ephemeris
VX Hya was monitored from 1954 to 1965 and a model of the light curve
was derived (Fitch (1966)). This model involves 2 oscillations:
n1=4.476495 1/day (period=5.36 h)
n2=5.789730 1/day (period=4.15 h)
T=2,435,000.0 (14 Sept 1954)
and a long-period modulation:
frequency nL=0.000227 1/day (period=12 yr)
TL=2,434,860.0 (27 Apr 1954)
the following way:
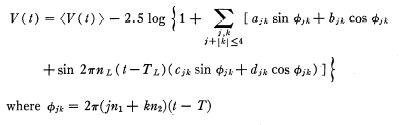
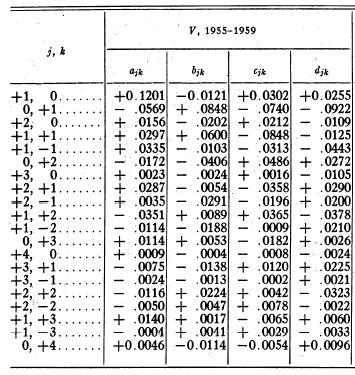
with <V(t)>=10.696 mag the average magnitude. The coefficients a,b,c,d
for the 1955-1959 period are given below. They do not fit correctly the
1964-1965 period.
Although this model is not supposed to work after 1959, I obtained a good fit of my 2005 observations, provided the T parameter is 1.428 hour late, and of my 2006 observations, with T 1.241 hour late.
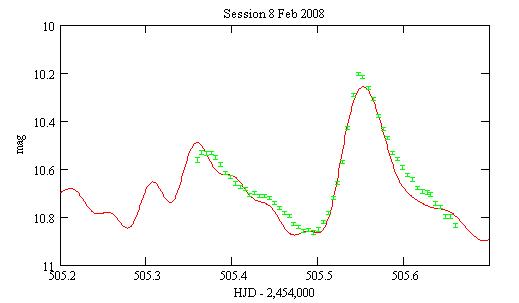
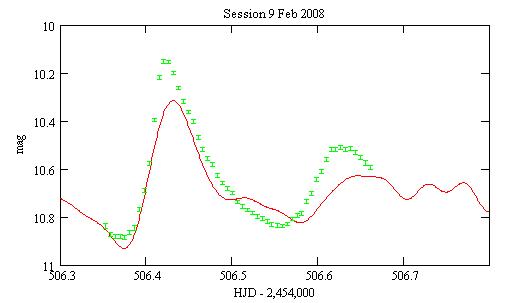
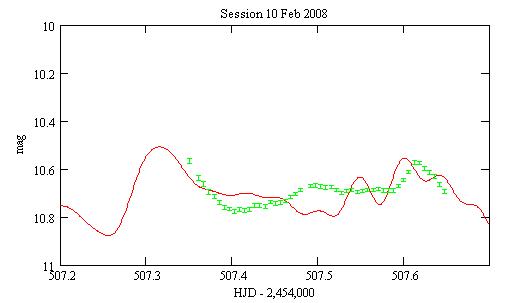
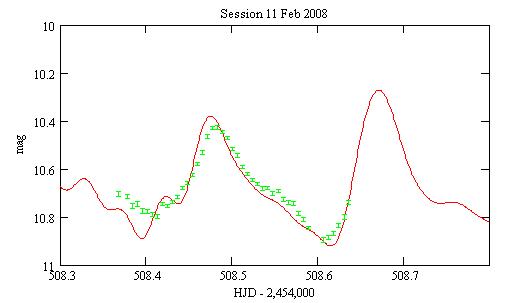
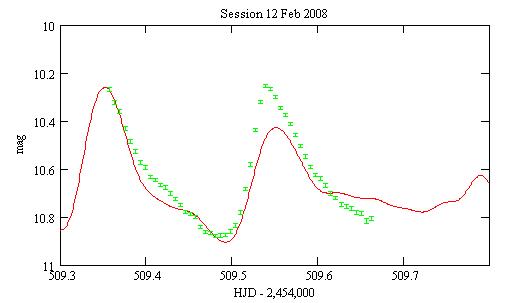
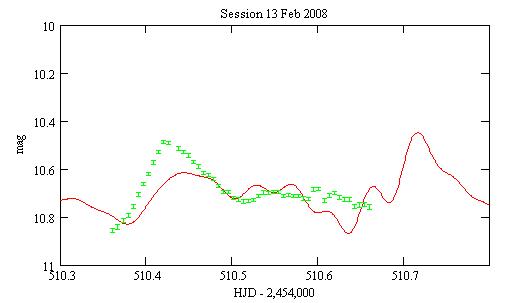
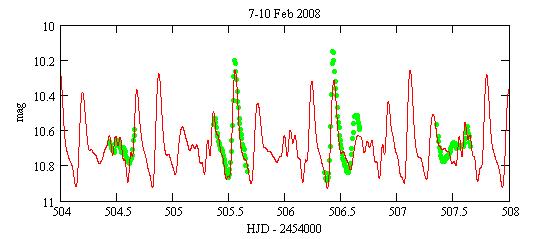
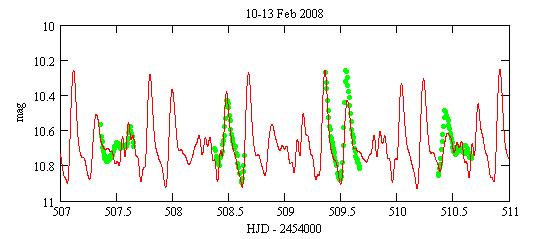
I can also fit these 2008 observations, but the T parameter has to be
3.700 hour early and <V(t)>=10.675 mag:
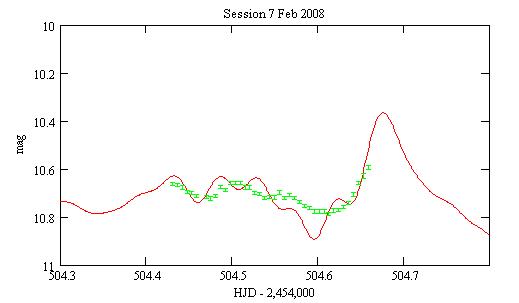
Red: Fitch's function, Green: the V observations.
Color variability
The B and V magnitudes being measured alternatively with a filter wheel, and not simultanously, the B magnitudes at the times of the V magnitudes are computed by interpolation. The origin of the B magnitudes is somewhat uncertain because the B magnitude of the comparison star is uncertain. The magnitudes are not transformed, however with my set up the transformation corrections are very small for B, V.
An example of color light curve:
Blue: the V-B magnitude differences; Green: the V magnitudes shifted by -10.5 magnitudes;
Red: the Fitch ephemeris (3.7h too early), shifted by -10.5 magnitudes.
All the color light curves are HERE.
The diagram for B-V versus V is linear with the star becoming bluer
when it is brighter. (This is unlike the usual loop diagram for pulsating
star):
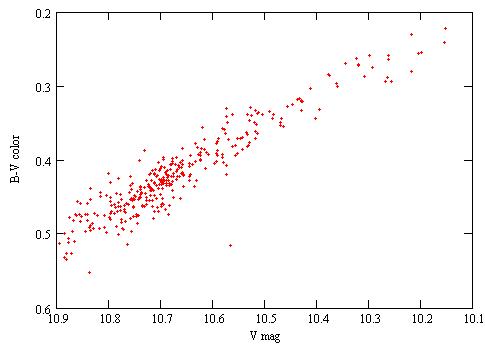
The slope of B-V vs V is 0.339.
Long term variability
I compare each maxima (the first is actually a minimum) I observed with
the Fitch ephemeris and I obtain a O-C value:
| Date | ToM (HJD - 2,454,000) |
O-C (mn) |
| 20080207 | 504.61 | -203 |
| 20080208 | 505.55 | -226 |
| 20080209 | 506.425 | -233 |
| 506.63 | -265 | |
| 20080210 | 507.615 | -200 |
| 20080211 | 508.48 | -216 |
| 20080212 | 509.54 | -238 |
| 20080213 | 510.42 | -259 |
I compiled a number of times of maxima
from Fitch (1966), Breger (1977), Klingenberg et al (2007), the
AAVSO and my 2005 and 2006
measurements. I then derive the O-C diagrams:
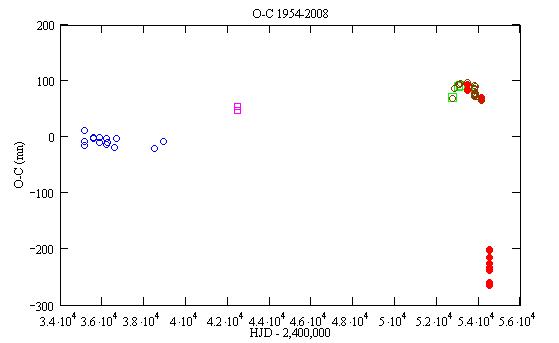
Blue circles: Fitch (1966), Magenta squares: Breger (1977), Green squares:
Klingengerg et al (2006), Brown circles: AAVSO, Red circles: my observations.
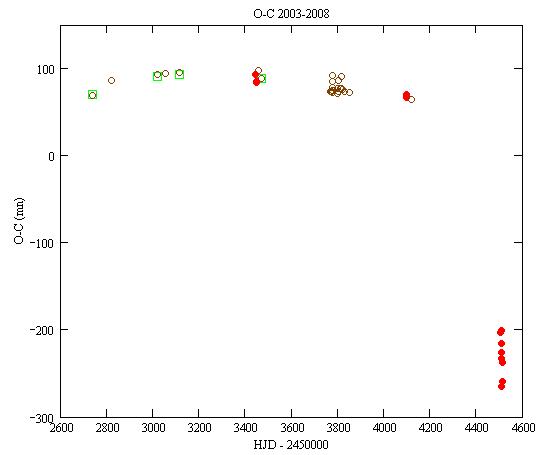
So, in 2007-2008 it looks like there is a strong change in the pulsation periods and/or the phases.
Discussion
From the extrapolations of the 2003-2007 measurements, one would expect that O-C being late by ~1h. I tried to fit the data with such a value of T but that did not give a good match. Also note that the average of the 5.36h and 4.15h is 4.75h, and that being early by 3.7h is then somewhat equivalent as being 1h late.
References
Breger M. (1977) PASP 89 55.
Fitch W.S. (1966) ApJ 143 852.
Klingenberg G., Dvorak S.W., Robertson C.W. (2006) IBVS 5701.
Acknowledgement
The use of the AAVSO International Database for this amateur research is acknowledged.
Astronomical notes
My 2005 observations and comparison with the Fitch's model.
My 2006 observations and other observations and comparison with the Fitch's model.
Technical notes
Telescope and camera configuration.
Computer and software configuration.
|
|
|||
|
|||
|
|
|||
|
|
|||
|
|||