VX Hya time keeping
Observations: 10, 11, 13, 16, 17, 18 March 2005
Michel Bonnardeau
19 April 2005
Revised 1 Feb 2008 (new comparison star)
Abstract
Time-series for this pulsating star with multiple oscillations are obtained. They are compared with the Fitch (1966) ephemeris: the matching is still good but with a delay of 1.4 hour.
Introduction
VX Hydrae is a pulsating star of the delta Scuti type. It shows multiple periodicities.
Observations
Time-series were carried out with a 203 mm SC telescope, Johnson V and B filters used alternatively and a SBIG ST7E camera (KAF401E CCD). 248 images were obtained with the V filter, 241 with the B one. Each exposure has a duration of 200 seconds.
The comparison star is Tycho 5482-01347. However, Tycho2 does not give reliable B magnitudes for this field. The adopted magnitudes for the comparison are then B=12.172 V=11.580.
The check star is GSC 5482-01054 with the observed magnitudes V=12.852 (average 1-sigma statistical uncertainty 0.019, standard deviation 0.024) and B=13.432 (0.039, 0.046).
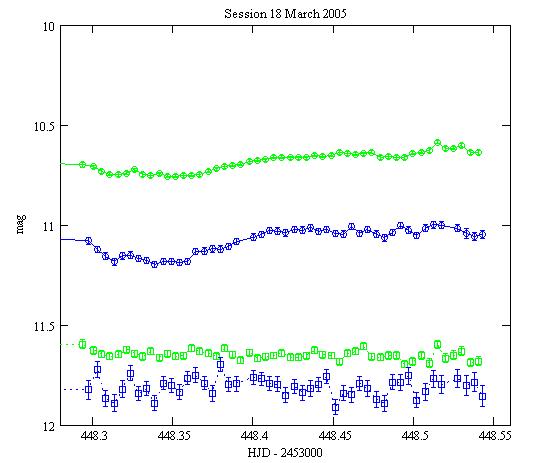
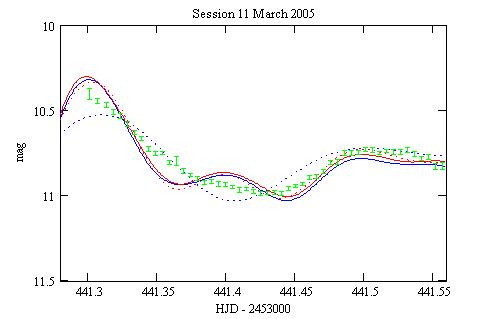
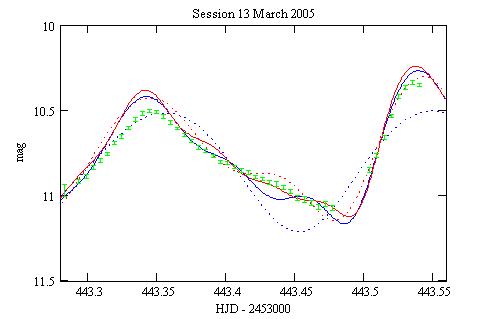
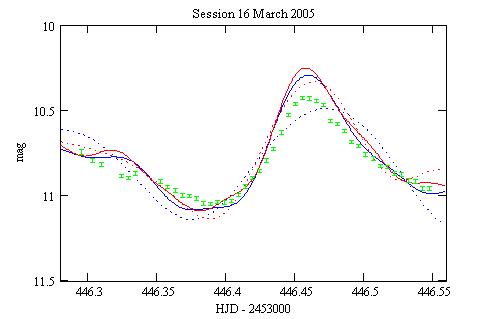
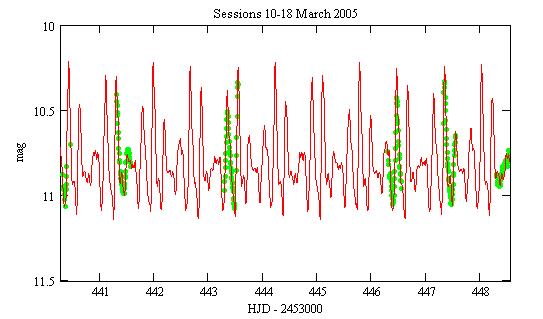
The light curves show patterns that are very different from one session
to another. Examples:
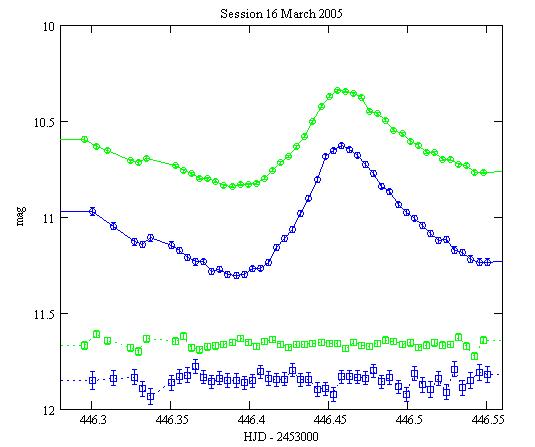
Green: with the V filter, Blue: with the B one.
Circles: VX Hya magnitudes, Squares: check star magnitudes shifted by
-1.2 mag in V, -1.6 in B.
The error bars are the +/- 1-sigma statistical uncertainties.
All the light curves are here.
Checking the ephemeris
VX Hya was monitored from 1954 to 1965 and a model of the light curve
was derived (Fitch 1966). This model involves 2 oscillations:
n1=4.476495 1/day (period=5.36 h)
n2=5.789730 1/day (period=4.15 h)
T=2,435,000.0 (14 Sept 1954)
and a long-period modulation:
frequency nL=0.000227 1/day (period=12 yr)
TL=2,434,860.0 (27 Apr 1954)
the following way:
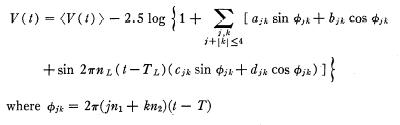
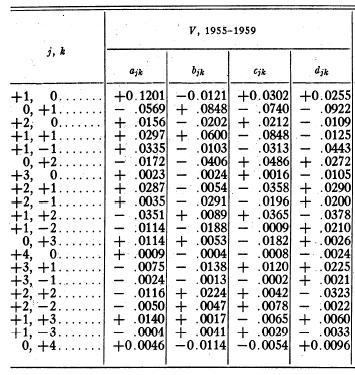
with <V(t)>=10.696 mag the average magnitude. The coefficients a,b,c,d
for the 1955-1959 period are given below. They do not fit correctly the
1964-1965 period.
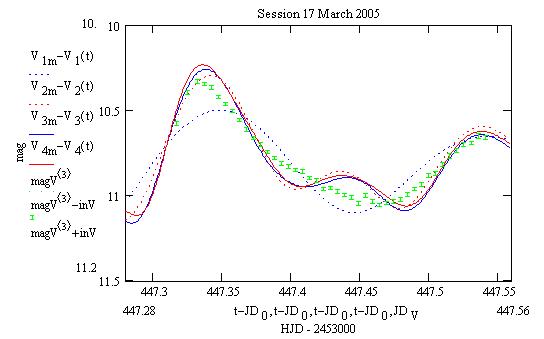
Although the above model is good only for the 1955-1959 period, I tried
to use it with my observations. It appears that the phase and the amplitude
are not right. I fitted T by hand and computed <V(t)> and obtained
a modelled light curve pretty close to the observations:
T = 2,435,000.0595 that is 1.428 hour late
<V(t)> = 10.634.
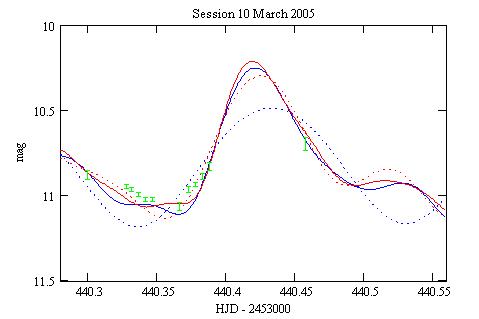
Blue dot: the first order term only; Red dot: 1st+2nd terms; Blue:
1+2+3; Red: all 4 terms.
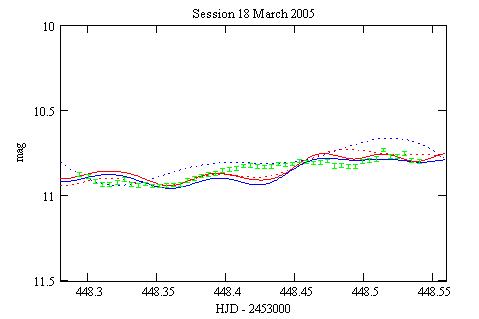
 With all 4 terms.
I have not tested the B magnitudes against the ephemeris, which is less detailled in this band.
Conclusions
After some 50 yr the model of Fitch is still giving realistic results (with a 1.4 hour shift). This may be considered as remarkable considering the complicated behavior of VX Hya.
Reference
Fitch W.S. (1966) ApJ 143 852.
Technical notes
Telescope and camera configuration.
Computer and software configuration.
Follow up
|
|
|||
|
|||
|
|
|||
|
|
|||
|
|||