VX Hya long term variability
Observed: 24, 25, 26, 27 Dec 2006
Michel Bonnardeau
29 Jan 2008
Updated 19 Feb 2008
Abstract
Time-series for this pulsating star with multiple oscillations are obtained. They are compared with the ephemeris of Fitch (1966): there is a delay of 1.2 hour. I also compile various observations and derive an O-C diagram from 1954 to 2007.
Introduction
VX Hydrae is a pulsating star of the delta Scuti type, with multiple periodicities. I already observed it in 2005 and found it late by 1.4 hour when compared with the 1954 ephemeris. Here are new observations:
Observations
The observations were carried out with a setup similar to the one used in 2005:
An example of a light curve:
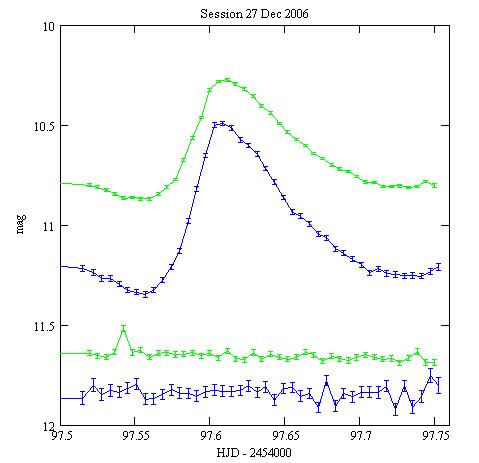
Green: with the V filter, Blue: with the B filter.
The upper 2 light curves are for VX Hya; the lower ones are for the check
star, shifted by -1.6mag in B, -1.2mag in V.
The error bars are +/- the 1-sigma statistical uncertainties.
The peak in the check star V light curve is because of a satellite.
All the light curves are HERE.
Comparison with the ephemeris
VX Hya was monitored from 1954 to 1965 and a model of the light curve
was derived (Fitch (1966)). This model involves 2 oscillations:
n1=4.476495 1/day (period=5.36 h)
n2=5.789730 1/day (period=4.15 h)
T=2,435,000.0 (14 Sept 1954)
and a long-period modulation:
frequency nL=0.000227 1/day (period=12 yr)
TL=2,434,860.0 (27 Apr 1954)
the following way:

with <V(t)>=10.696 mag the average magnitude. The coefficients a,b,c,d
for the 1955-1959 period are given below. They do not fit correctly the
1964-1965 period.

Although this model is not supposed to work after 1959, I obtained a good fit of my 2005 observations, provided the T parameter is 1.428 hour late.
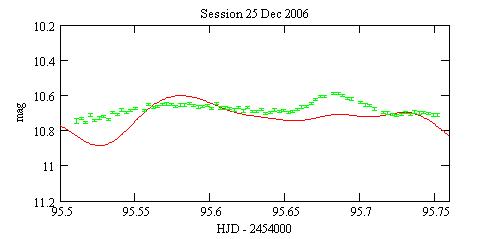
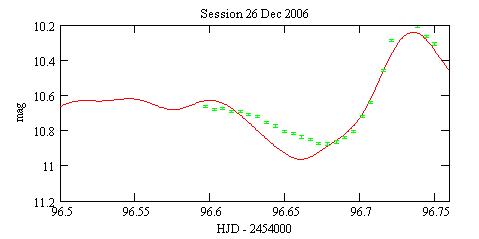
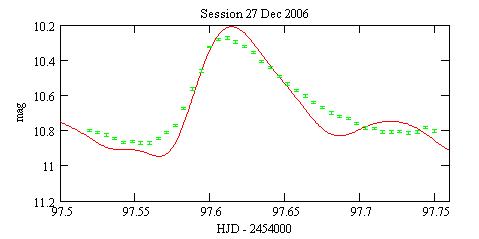
The model also fit the 2006 observations, with T 1.241 hour late and
<V(t)>=10.683 mag:
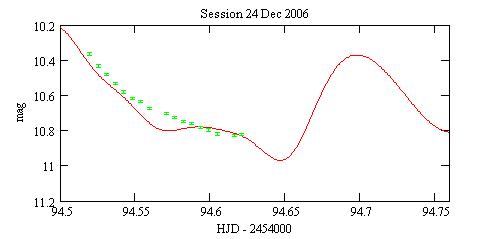
Green: the V measurements, Red: the model.

Long term variability
I compile a number of maxima from the light curves, compare them with the Fitch (1966) model, and I derive a O-C diagram:
In 2005, I observed 3 maxima:
| Date | ToM (HJD-2,453,000) | O-C (mn) |
| 20050313 | 443.348 | 94 |
| 20050316 | 446.457 | 85 |
| 20050317 | 447.335 | 84 |
In 2006 I observed 2 maxima:
| Date | ToM (HJD-2,454,000) | O-C (mn) |
| 20061226 | 96.684 | 66 |
| 20061227 | 87.563 | 71 |
Breger (1977) published the light curves for 2 maxima:
| Date | ToM | O-C (mn) |
| 19750113 | 2,442,426.4236 | 55 |
| 19750117 | 2,442,430.4168 | 49 |
Klingenberg et al (2006) reported 5 times of maxima for 2003-2005,
with no light curves:
| Date | ToM (HJD - 2452000) | O-C (mn) |
| 20030406 | 735.6067 | 70 |
| 20040112 | 1016.9122 | 91 |
| 20040418 | 1113.6364 | 93 |
| 20050407 | 1467.6958 | 89 |
| 20050416 | 1476.5976 | ? |
For the last time of maximum, I cannot find a match with the Fitch's prediction.
From the light curves in the AAVSO International Database, 27 maxima can be identified,
from 2003 to 2007:
| Date | ToM (JD - 2452000) | heliocentric correction (s) |
ToM (HJD - 2452000) | O-C (mn) | Observer |
| 20030406 | 735.602 | 335.7 | 735.6059 | 69 | DKS |
| 20030629 | 819.86 | -254.4 | 819.8571 | 86 | BIW |
| 20040112 | 1016.91 | 333 | 1016.9138 | 93 | DKS |
| 20040216 | 1051.975 | 447.6 | 1051.9802 | 94 | BIW |
| 20040418 | 1113.635 | 261.8 | 1113.6380 | 95 | DKS |
| 20050323 | 1452.9 | 396.4 | 1452.9046 | 97 | BIW |
| 20050407 | 1467.692 | 327.8 | 1467.6958 | 89 | DKS |
| 20060202 | 1768.767 | 421.8 | 1768.7719 | 73 | DKS |
| 20060204 | 1771.005 | 427.1 | 1771.0099 | 73 | BIW |
| 20060207 | 1773.74 | 434.7 | 1773.7450 | 91 | DKS |
| 20060208 | 1774.803 | 436.9 | 1774.8081 | 72 | DKS |
| 20060209 | 1775.69 | 438.6 | 1775.6951 | 78 | DKS |
| 20060210 | 1776.853 | 440.6 | 1776.8581 | 85 | DKS |
| 20060210 | 1777.044 | 440.9 | 1777.0491 | 75 | BIW |
| 20060302 | 1796.718 | 447.3 | 1796.7232 | 77 | DKS |
| 20060303 | 1797.5935 | 446.3 | 1797.5987 | 72 | DKS |
| 20060304 | 1798.782 | 444.8 | 1798.7871 | ? | DKS |
| 20060305 | 1799.647 | 443.7 | 1799.6521 | 87 | DKS+GHS |
| 20060306 | 1800.715 | 442 | 1800.7201 | 74 | DKS |
| 20060317 | 1811.915 | 416.7 | 1811.9198 | 78 | BIW |
| 20060318 | 1812.605 | 413.7 | 1812.6098 | 90 | DKS |
| 20060319 | 1813.673 | 410.5 | 1813.6777 | 77 | DKS |
| 20060326 | 1820.592 | 384.8 | 1820.5964 | 76 | DKS |
| 20060401 | 1826.627 | 358.2 | 1826.6311 | 74 | DKS |
| 20060425 | 1850.98 | 217.5 | 1850.9825 | 73 | BIW |
| 20070115 | 2115.918 | 351 | 2115.9221 | 65 | DKS |
| 20070228 | 2159.759 | 449.2 | 2159.7642 | ? | DKS |
For the light curves at 20060304 and 20070228, I cannot find a match with the Fitch's prediction.
From the Table 1 of Fitch (1966), 15 maxima can be identified:
| Date | ToM (HJD - 2,435,000) | O-C (mn) |
| 19541228 | 104.998 | -18 |
| 19541230 | 107.0417 | -5 |
| 19550123 | 130.928 | 12 |
| 19560303 | 535.722 | -3 |
| 19560319 | 551.7977 | 0 |
| 19560408 | 571.6719 | 0 |
| 19561228 | 835.938 | 0 |
| 19570126 | 864.7578 | -10 |
| 19571222 | 1194.975 | -3 |
| 19571227 | 1199.8408 | -13 |
| 19571229 | 1201.885 | -9 |
| 19581212 | 1549.924 | -19 |
| 19590307 | 1634.783 | -3 |
| 19640305 | 3459.6837 | -21 |
| 19650507 | 3887.685 | -9 |
The maxima are detected "by eye" from the Table 1, so the differences with the ephemeris are only approximative.
The resulting O-C diagrams:
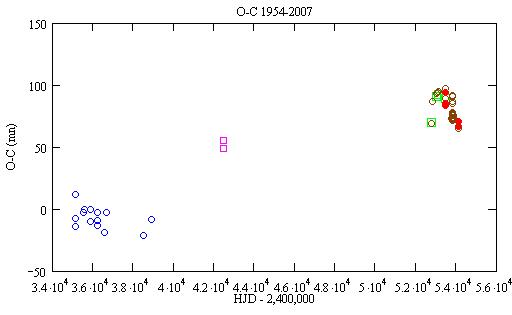
Blue circles: Fitch (1966), Magenta squares: Breger (1977), Green squares:
Klingengerg et al (2006), Brown circles: AAVSO, Red circles: my observations.


On can see that:
References
Breger M. (1977) PASP 89 55.
Fitch W.S. (1966) ApJ 143 852.
Klingenberg G., Dvorak S.W., Robertson C.W. (2006) IBVS 5701.
Acknowledgement
The use of the AAVSO International Database for this amateur research is acknowledged.
Astronomical note
My 2005 observations and comparison with the Fitch's model.
Technical notes
Telescope and camera configuration.
Computer and software configuration.
|
|
|||
|
|||
|
|
|||
|
|
|||
|
|||