SZ Mon, the double pulsator
Observed: 35 sessions from 23 Dec 2005 to 11 Mar 2007
Michel Bonnardeau
29 May 2007
Updated 5 July 2007 (distance, temperature,
luminosity, radius as a function of E(B-V))
Revided 30 Dec 2007 (improved transformations)
Abstract
Photometry of this pulsating supergiant star (33d period) are presented. The magnitudes are compared with published observations. The measurements are also corrected for a nearby star. Variations of the color, temperature, radius and luminosity are inferred.
Introduction
SZ Mon is a pulsating star of the RV Tau type, that is a yellow supergiant with a double pulsation and alternating primary and secondary minima.
According to the GCVS the ephemeris for the pulsation is:
t(E) = 2,440,550.0 (1969/11/24) + 32.685*E
Observations
The observations were carried out with a 203mm f/6.3 SC telescope, B and V filters and a SBIG ST7E camera (KAF401E CCD). The comparison star is Tycho 4800-02165 with the Johnson magnitudes B=11.200 and V=11.094 (computed from the Tycho magnitudes owing to Mamajek et al (2002 & 2006)). The check star is GCS 4800-02059 with the measured magnitudes B=12.730 (standard deviation 0.060) and V=11.325 (0.016).
39 measurements were obtained with the V filter, 33 with the B filter.
2x28 are quasi-simultaneous V and B measurements that will be used to
derive B-V. It tooks me 15 months to cover SZ Mon 1-month long period
because of my weather pattern (a few days of good anticyclonic sky followed
by many weeks of clouds).
All the measurements are HERE.
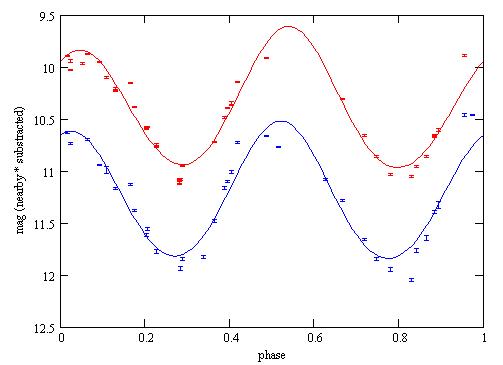
Folding the data with the GCVS ephemeris gives the phase plot:
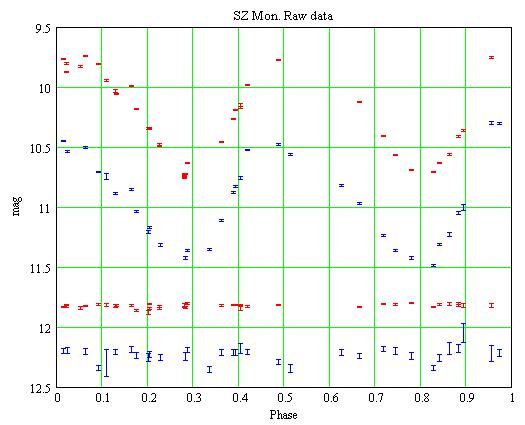
Red: the V measurements, Blue: the B ones. The error bars are +/- the
1-sigma statistical uncertainties. For the check star, the V magnitudes
are shifted by +0.5 mag, the B ones by -0.5 mag.
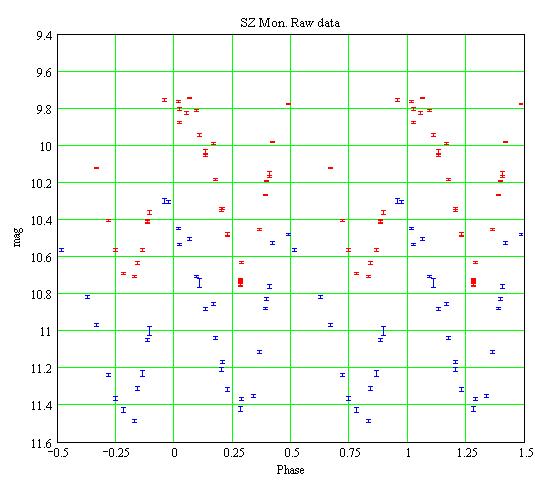
Comparaison with previous observations
SZ Mon was observed by ASAS
(Pojmanski (2002)) mostly in 2002-2004. Folding the data with the GCVS
ephemeris gives:
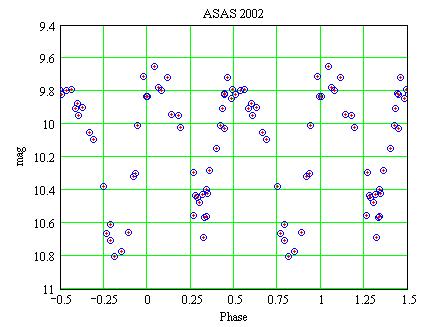
The ASAS data for 2002 (average JD=2,452,572). Red cross: the V measurements,
Blue circle: the Ic measurements. Note that there is very little difference
between the V and Ic magnitudes.
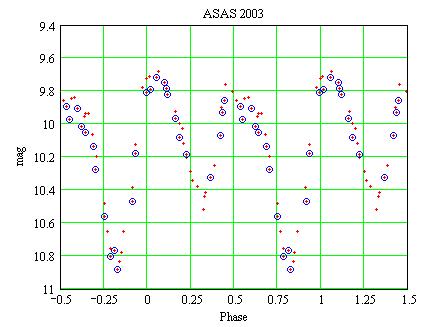
The data for 2003 (average JD=2,453,005).
SZ Mon was also observed in 1999-2000 (average JD=2,451,548) by SkyDot/ROTSE-I/NSVS.
Folding the data with the GCVS ephemeris gives:
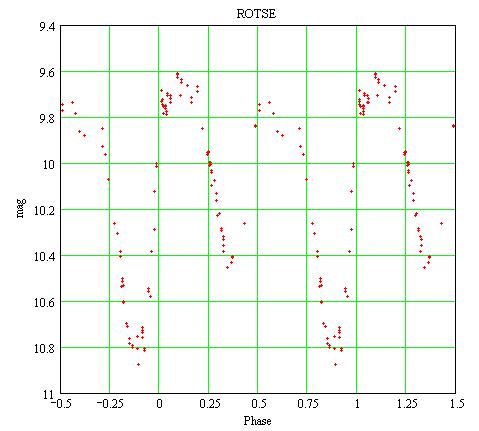
Unfiltered magnitudes.
It was also observed in 1999 (average JD=2,451,234) by the AFOEV
(observer KIS, Kiyota S., Japan). Folding the data with the same ephemeris:
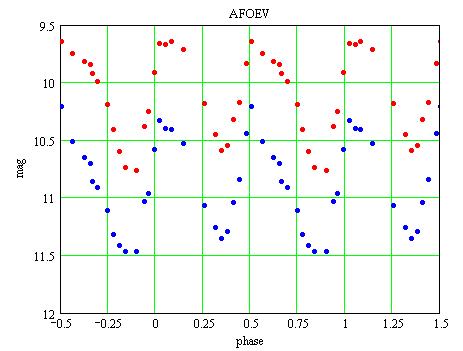
Red dots: V magnitudes, Blue dots: B magnitudes.
SZ Mon was also observed by Lloyd Evans (1970) and Stobie (1970). They report a maximum around 9.8 (V magnitude) and minima around 10.6 for the phase around 0.25 and 10.8 for the other one. (Note that they used a different ephemeris with the maximum at phase 0.0 in the GCVS ephemeris that comes at phase 0.5).
These observations (including mine) show that the maxima of the 2 pulses
are roughtly constant around V=9.8 but that the 2 minima are variable:
| Observations | year | min phase 0.25 |
min phase 0.75 |
| Lloyd Evans (1970) Stobie (1970) |
1969 | 10.6 | 10.8 |
| AFOEV (V mag) | 1999 | 10.6 | 10.8 |
| ROTSE (unfiltered) | 2000 | 10.4 | 10.8 |
| ASAS | 2002 | 10.7 | 10.8 |
| ASAS | 2003 | 10.5 | 10.9 |
| My observations | 2006 | 10.8 | 10.7 |
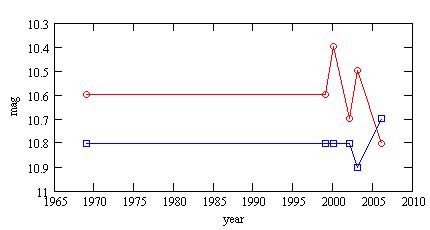
Red circles: minima around phase 0.25,
Blue squares: minima around phase 0.75.
Such variations of the minima are a characteristic of the RV Tau type.
Substraction of a nearby star
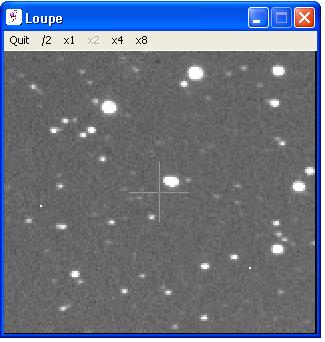
SZ Mon is the bright object near the cross hair, it looks elongated.
The image width is 6', North is up, East is left.
At the East of SZ Mon, a few arcseconds away, there is a fairly bright
star. The above magnitudes include the contribution from this star. Let
be m the measured magnitude (the sum of SZ Mon and of the nearby star).
The magnitude of SZ Mon, mSZ, can then be computed
iteratively:
mSZ = m + 2.5*log[1+k*10^(mSZ/2.5)]
with k a constant (assuming the nearby star is constant).
k is computed by analyzing the East-West profile when SZ Mon is near a minimum so as to have a better view of the nearby star:
Then:
mSZ = m+2.5*log(1+Inearby/ISZ)
k = (Inearby/ISZ)*10^(-mSZ/2.5)
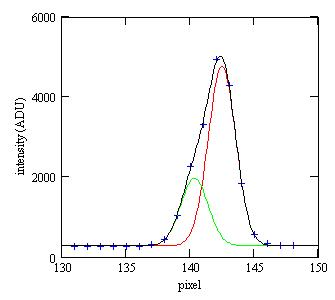
Blue crosses: the measured intensities;
Red line: the PSF for SZ Mon;
Green line: the PSF for the nearby star;
Black line: the sum of the two PSF (and of a constant background).
I did this analysis with 3 images taken with the B filter and 3 images
with the V filter. The results are:
average kB = 1.022E-5 (standard deviation 0.115E-5)
average kV = 1.421E-5 (standard deviation 0.061E-5)
The magnitudes of SZ Mon with the nearby star substracted are HERE. (I did not propagate the standard deviation on k because, whatever the error on k is, k is constant in time).
I can also compute the magnitudes of the nearby star: B=12.480 V=12.119, and its distance to SZ Mon: 6". (B-V=0.36 so the star is not red and unlikely a variable).
Color variations
The measured b,v magnitudes may be transformed
for the instrument response. The transformed B,V magnitudes are then:
V = v + TvTbv*[(b-v)-(Bc-Vc)]
B = b + TbTbv*[(b-v)-(Bc-Vc)]
Bc,Vc are the magnitudes of the comparison star. The transformation coefficients
were measured HERE;
they are:
TbTbv = 0.002+/-0.027
TvTbv = -0.025+/-0.015
The transformed magnitudes are HERE.
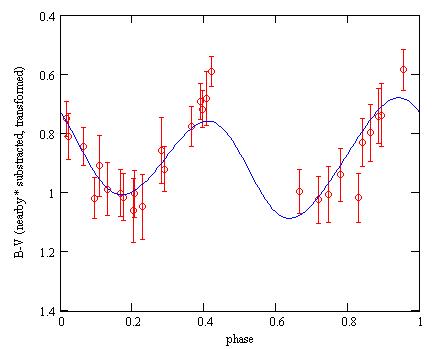
The B-V color as a function of the V magnitude is then:
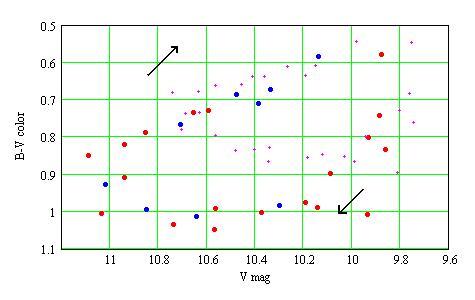
Red dots: phase [0.8,0.3[ i.e. the pulse at phase 0.0;
Blue dots: phase [0.3,0.8[ i.e. the pulse at phase 0.5;
for these dots, the magnitudes are substracted for the nearby star and
are transformed.
Magenta small crosses: the raw magnitudes.
The diagram is run twice per period, in the direction of the arrows.
The star is bluer when it becomes brighter. The two pulses run the same
loop diagram.
Compared with the 1999 AFOEV observations, SZ Mon looks more bluish
in 2006, especially when the intensity is rising:
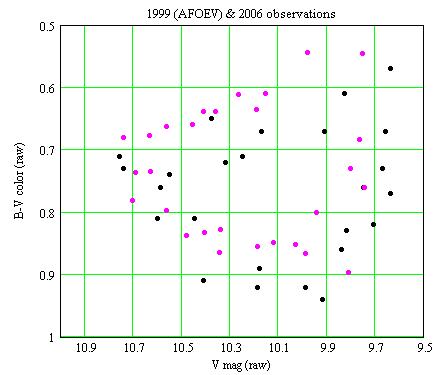
Magenta dots: my observations (2006); Blacks dots: AFOEV observations
(1999).
Temperature and diameter variations
There are 28 pairs of B,V measurements for 39 individual measurements
in V and 33 in B. To be able to interpolate, the V and B magnitudes are
fitted with the following functions of the phase:
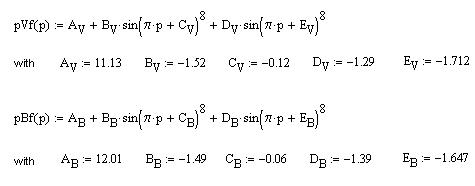
Red dots: the V measurements with the nearby star subtracted;
Red line: the pVf(p) function;
Blue: the same for the B filter.
The resulting B-V versus phase diagram:
Blue line: the pBf(p)-pVf(p) function corrected for the transformation;
Red: the measured B-V color. The error bars are the 1-sigma statistical
uncertainties, corrected for the nearby star and the uncertainties on
the transformation coefficients.
According to Reed (1998) the effective temperature T (°K) can be computed
as a function of B-V:
B-V = -3.684*log(T) + 14.551 (when T below 9100°K)
Barnes and Evans (1976) considered a large number of measured star diameters
(from occultation, interferometry, etc) and discovered the following empirical
relation between the angular diameter phi (in milliarcseconds), the V
magnitude and the B-V color:
4.2207 -0.1*V -0.5*log(phi) = 3.964 - 0.333*(B-V)
The effective temperature and the angular diameter can then be computed
as a function of the phase:
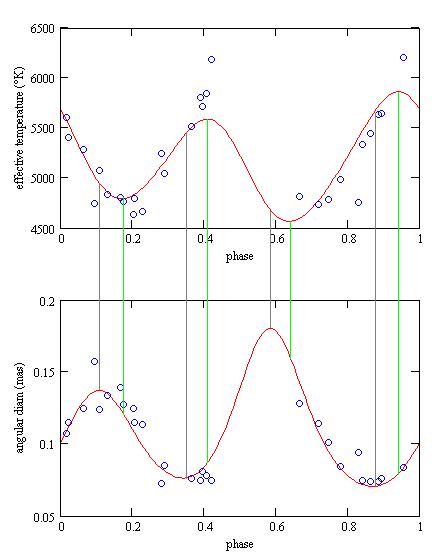
It looks like the temperature and diameter are not exactly synchronized:
when the radius is maximum, the temperature is near its minimum and will
continue to decrease for a little while as the radius starts to diminish.
Distance determination
RV Tau stars have an absolute magnitude around M=-4 (there are at the
upper right part of the Hertzprung-Russel diagram). SZ Mon is observed
with an average magnitude m=10.47 (V filter, with the nearby star substracted,
transformed). The distance to SZ Mon is then:
d = 10^(m-M+5)/5 = 7.8kpc = 23,000lyr
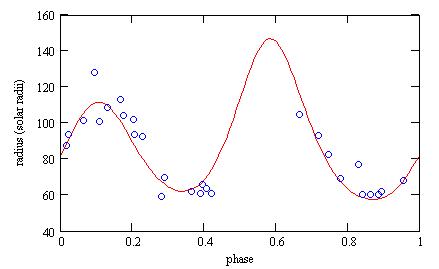
The radius is then around 80 solar radii:
The absolute V magnitudes Mv (at 10pc) may be computed from the measured
V magnitudes and the distance d:
Mv = 5 + V - 5*log(d)
The luminosity L(p) as a function of phase p is then (in Sun luminosity
unit):
L(p) = 10^(Mv(p)-Mov+BC(T)-BC(To))/-2.5
where Mov=4.89 is the Sun absolute V magnitude, To=5780°K its effective
temperature, and BC is the bolometric correction. BC, a function of the
effective temperature, is given by Reed (1998) as:
BC(T) = C6*(log(T)-4)^4 + C7*(log(T)-4)^3 + C8*(log(T)-4)^2 + C9*(log(T)-4)
+ C10
with C6=-8.499 C7=13.421 C8=-8.131 C9=-3.901 C10=-0.438.
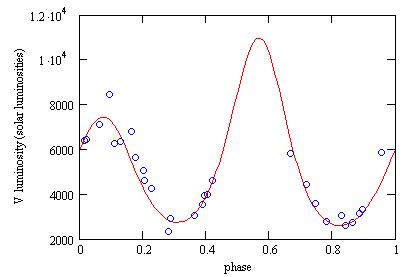
The luminosity is then around 7,000 times the solar luminosity:
Interstellar extinction
The interstellar absorption Av in V can be computed as a function
of the interstellar reddening E(B-V) as:
Av=R*E(B-V) with R=3.1 for the Milky Way.
The above calculations can then be redone as a function
of E(B-V):
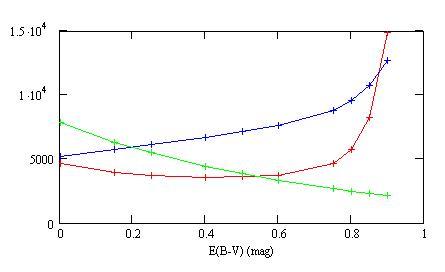
Green: the distance (in pc);
Blue: the average effective temperature (in °K);
Red: the average luminosity (in solar luminosities).
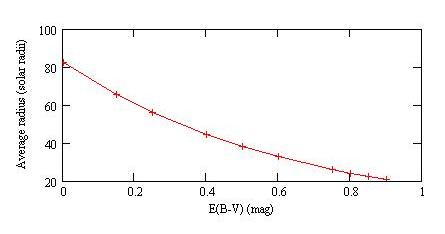
The average radius (in solar radii) as a function of the reddening.
References
Barnes T.G., Evans D.S. (1976) MNRAS 174 489.
Lloyd Evans T. (1970) The Observatory 90 254.
Mamajek E.E., Meyer M.R., Liebert J. (2002) AJ 124 1670 Appendix
C;
erratum (2006) AJ 131 2360.
Pojmanski G. (2002) Acta Astronomica 52 397.
Reed C. (1998) J. RAS of Canada 92 36.
Stobie R.S. (1970) MNRAS 148 1.
Acknowledgements
This amateur research has made use of the AFOEV database, operated at CDS (France) and of SkyDot/ROTSE-I/NSVS data.
Technical notes
Telescope and camera configuration.
Computer and software configuration.
Transformations for differential photometry.
Transformation coefficients: B, V measurements.
Astronomical notes
Pulsating stars and its links.
TX Mon (a Cepheid) in the same field of view.
Similar determinations of the temperature, radius and luminosity are HERE.
|
|
|||
|
|||
|
|
|||
|
|
|||
|
|||