W Vir: temperature, radius and radial velocity determinations from B, V photometry
Observed: 16 observing sessions from 27 April to 20 July 2005
Michel Bonnardeau
12 Sept 2005
Abstract
V and B magnitudes measurements are obtained for this Population
II Cepheid pulsating star. They are used to compute the variations of
temperature, radius and radial velocity.
The results are compared with
direct measurements from spectroscopy.
Introduction
W Virginis is a pulsating star, the prototype of the Population II Cepheids.
In the GCVS, there is the ephemeris for its pulsation:
P0 = 17.2736 days
t0 = 2,432,697.783 (26 May 1948)
Observations
The observations were carried out with a 203 mm f/6.3 SC telescope, a SBIG ST7E camera (KAF401E CCD) and B, V filters. 36 images were obtained with the V filter, 35 with the B filter. Most of the exposures are 200s long, sometimes there are 3x60s. They span 16 observing sessions from 27 April to 20 July 2005. The coverage is not too good because of adverse weather.
The comparison star is Tycho 2 4962-00167 with the Johnson magnitudes B=12.850 and V=12.385 computed from the Tycho magnitudes using Mamajek et al (2002). The check star is GSC 4962-00165 with the measured magnitudes V=13.149 (standard deviation 0.084) and B=13.821 (standard deviation 0.128).
All the measurements are HERE.
The resulting phase plot is computed from the GCVS ephemeris and I added 0.05
to be in phase with Arp's data (see below):

Green: with the V filter, Blue: with the B filter. The error bars
are +/- the 1-sigma statiscal uncertainties. The lines are best fits (see
below).
Distance
Population II Cepheids have their period P0 related to the absolute
average V magnitude by (Fernie (1964)):
M = -0.28 -2.1*log(P0)
From my measurements, the apparent average V magnitude is 9.978.
The distance to W Vir is then: D = 3.6kpc = 11,000lyr.
Time keeping
W Vir was observed in 1954 (Arp (1957)). The maximum I observed is 0.05*P0 too early when compared with Arp's. This suggests a small decrease of the pulsation period from 1954 to 2005.
According to Percy & Hoss (2000), the period is decreasing at a rate of -0.00025, mostly from mid-XIXth century and early XXth century data. With a rate that strong, the maximum I observe should be 0.26*P0 in advance from Arp's, suggesting that the period decrease might be slowing down now.
Modelling the observations
I did not have a good coverage of the phase, especially for the ascending and descending branch of the light curve. (Actually, there is a hump in the ascending branch that I missed). I fit then each of the V and B light curves with a mathematical function, to be able to interpolate between observations and to compute B-V over the phase.
The V data are fitted with the function:

where t is the phase, with:
m=2
a0=-0.85 b0=-0.6 a1=-1.1 b1=0.42
c=10.651
The B data are fitted with a similar function with:
a0=-1.14 b0=-0.55 a1=-1.55 b1=0.48
c=11.598
The measured magnitudes are corrected for the transformations coefficients:
B = b + Tb*Tbv*[(b - v) - (Bc - Vc)]
V = B - [(Bc - Vc) + Tbv*[(b - v) - (Bc - Vc)]]
where b, v are the measured magnitudes, Bc, Vc the magnitudes of the comparison
star. Tb and Tbv are the transformations coefficients. They were measured
on 7 Jan 2005 from the Landolt 95 field with the same telescope, camera
and filters:
Tbv = 0.967
Tb = -0.043
It is then possible to compute B-V as a function of the phase:

Temperature variation
The effective temperature (°K) of the star surface may be estimated from the B-V
magnitude owing to Reed (1998):
B-V = -3.684.log(T) + 14.551 (when T <9100°K)
Then one has the temperature variation with the phase:

Red: the effective temperature; Dot Green and Blue: the V and B magnitudes
respectively, on the same arbitrary scale.
Radius determination
I use 2 different methods to compute the star radius as a function of the phase:
Radius from the surface brightness method
According to Barnes and Evans (1976) one has:
4.2207 -0.1*V -0.5*log(phi) = 3.964 - 0.333*(B-V)
where phi is the angular diameter in arc milliseconds. With the distance
D, the radius can readily be computed:

Red: the radius; Dot Green and Blue: the V and B magnitudes
respectively, on the same arbitrary scale.
Radius from the bolometric method
The absolute V magnitude Mv (at 10pc) may be computed from the measured
V magnitude and the distance D:
Mv = 5 + V - 5*log(D)
The Sun has an absolute V magnitude of Mov=4.89. The
luminosity L(t) as a function of phase t of W Vir is then
(in Sun luminosity unit):

where To=5780°K is Sun effective temperature, and BC is the bolometric correction.
BC as a function of the effective temperature is given by Reed (1998) as:
BC(T) = C6*(log(T)-4)^4 + C7*(log(T)-4)^3 + C8*(log(T)-4)^2 + C9*(log(T)-4) + C10
with C6=-8.499 C7=13.421 C8=-8.131 C9=-3.901 C10=-0.438.
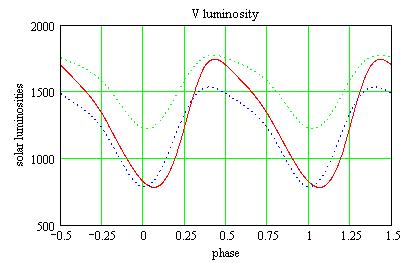
The variation of the luminosity is then:

Red: the luminosity; Dot Green and Blue: the V and B magnitudes
respectively, on the same arbitrary scale.
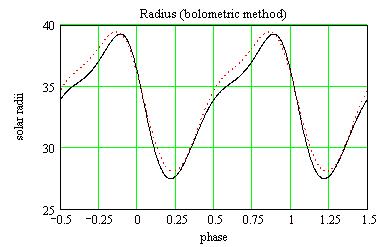
The luminosity being proportional to R^2 and T^4, the radius R(t) is (in
solar radii):

Black: the radius computed from the bolometric method, Dot Red: the
previous computation from the surface brightness method.
Radial velocity
The radial pulsational velocity RV(t) as a function of the phase may
be computed by deriving the radius R:
RV(t) = dR(t)/dt

Red and Black: the radial velocities computed from the surface brightness method
and the bolometric method, respectively;
Dot Green and Blue: the V and B magnitudes
respectively, on the same arbitrary scale.
Robutness
Uncertainty on the magnitudes: The uncertainty on the Tycho magnitudes of the comparison star are rather large: 0.255 in V, 0.308 in B. I check how the errors on the V magnitude propagate in the calculations:
Uncertainty on the differential B-V: Large uncertainties on the V and B magnitudes of the comparison star does not necessarily imply that the differential B-V has a large uncertainty. I assume the B-V of the comparison star is reliable, and this is generally true with Tycho observations.
Interstellar extinction:
The interstellar extinction has not been taken into account. Its effect
is to increase V and B-V. Correcting for the interstellar extinction
would increase the computed temperature.
For the radius, correcting V would increase the radius, but the correction
B-V is to diminish it. Therefore the interstellar extinction would have
little effect on the radius computation. This was also noted by Barnes
and Evans (1976).
Comparison with velocity measurements by spectroscopy
The radial velocity as a function of the phase was measured directly by spectroscopy, from the Doppler shift of lines, by Lebre & Gillet (1992) (LG92). They also integrate the velocity to compute the radius variation.
I observe that the radius is minimum when the luminosity is maximum, and that it becomes maximum at the end of the plateau. This is in agreement with LG92. However, I have some kind of wave at phase 0.6 that LG92 do not observe.
I observe a radius variation amplitude of 12 solar radii. LG92 report amplitudes ranging from 22.2 to 35.7, depending upon the observed lines. They explain these different ranges by the lines being exited at different depths in the photosphere. I suggest that my smaller amplitude comes from observing deeper into the photosphere than LG92.
I observe that the star is contracting at its maximum rate (30km/s) when the luminosity is at its minimum, and expanding (10km/s) when the luminosity is at its maximum. LG92 report the same behavior, but with a steady variation of the velocity while I obtain some kind of plateau.
I obtain a velocity range of 45 km/s. LG92 report velocity ranges going from 64.5 to 157.1 km/s, depending upon the spectral lines. These differences may come from observing at different depths in the photosphere.
Comparison with Arp (1957) observations
The temperature and radius variations can also be computed from the B and V measurements of Arp (1957). The results are similar to those from my observations, with slightly larger amplitudes. The details are HERE.
References
Arp H. C. (1957) AJ 62 129.
Barnes T.G., Evans D.S. (1976) MNRAS 174 489.
Fernie J. D. (1964) AJ 69 258.
Lebre A., Gillet D. (1992) A&A 225 221.
Mamajek E., Meyer M., Liebert J. (2002) AJ 124 1670 (appendix C).
Percy J. R., Hoss J. X. (2000) JAAVSO 29 14.
Reed C. (1998) J. RAS of Canada 92 36.
Technical notes
Telescope and camera configuration.
Computer and software configuration.
Astronomical notes
Similar determinations of the temperature, radius and luminosity are HERE.
Pulsating stars and its links.
|
|
|||
|
|||
|
|
|||
|
|
|||
|
|||
